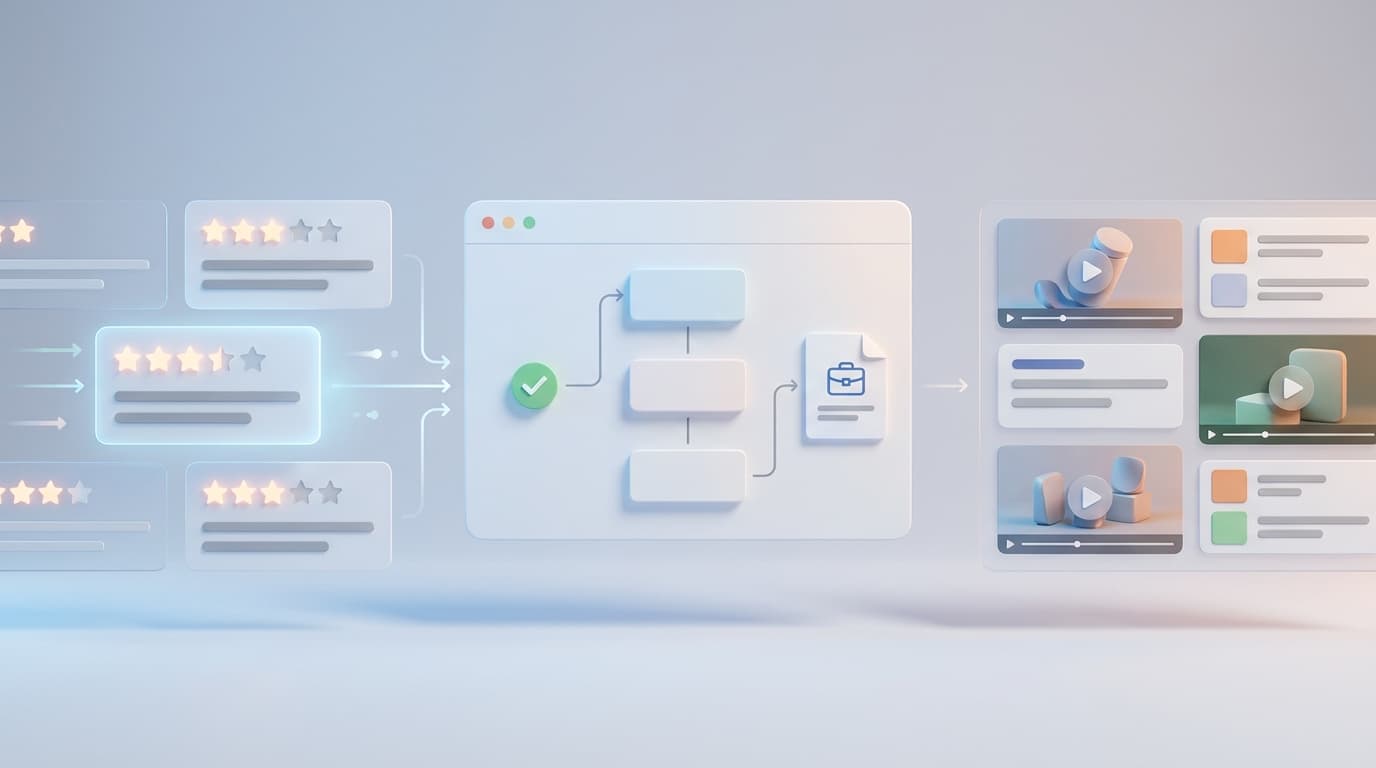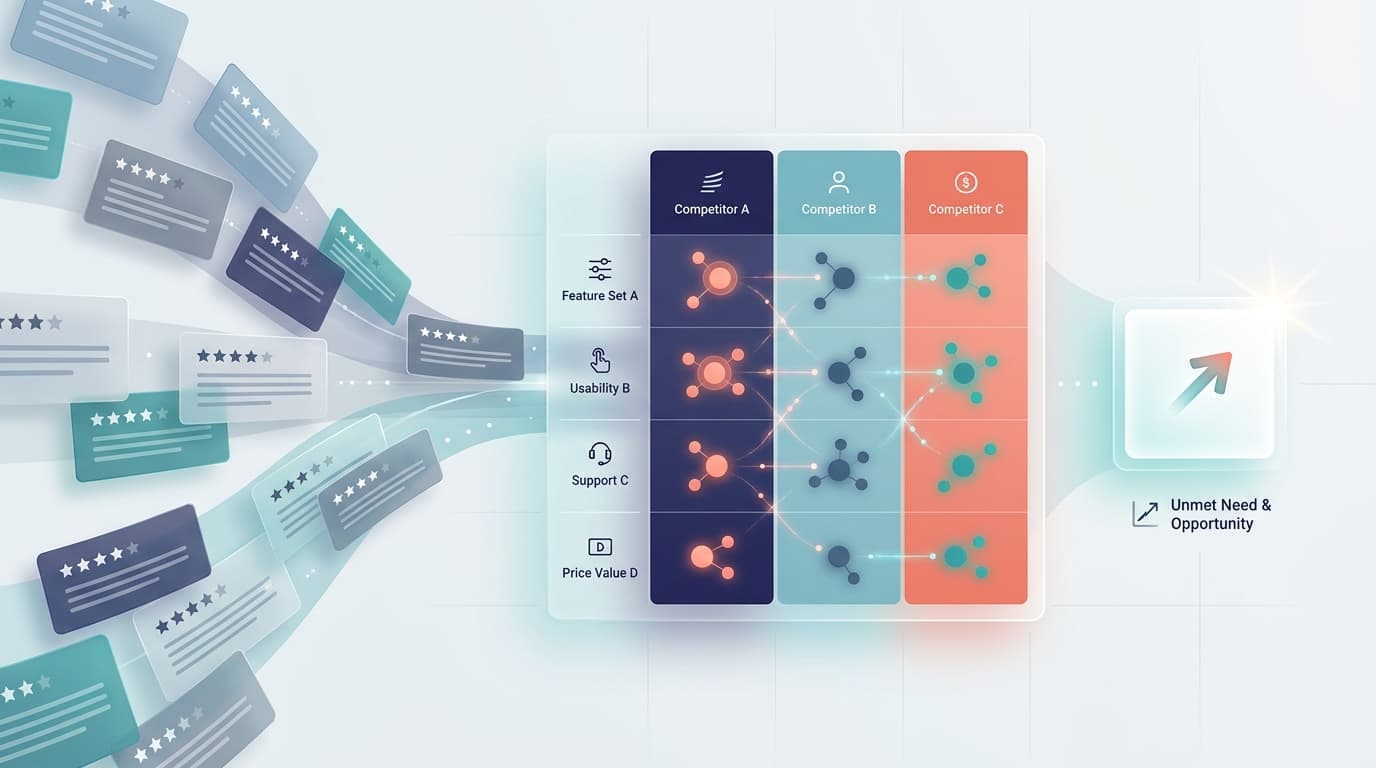
Amazon market research often ends with a product shortlist: demand looks healthy, competition appears manageable, and the projected price leaves room for margin. Those signals help answer what might be worth selling. They do not fully answer when to enter the category—or whether the current demand reflects a durable customer need, a seasonal window, or a short-lived spike.
Launch timing becomes more reliable when you combine two types of evidence:
- Quantitative market signals such as search behavior, purchase trends, pricing, niche saturation, and seasonality.
- Qualitative customer signals such as repeated complaints, desired outcomes, product-use scenarios, return reasons, and features buyers consistently praise.
The first layer shows where activity is happening. The second explains why customers are buying, hesitating, returning products, or asking for something better. This guide shows how to combine both layers into an Amazon category-timing scorecard your team can use before committing inventory, tooling, or launch budget.
Why launch timing needs more than a demand chart
A rising demand curve is attractive, but it can represent very different situations.
- A category may be growing because a persistent customer problem is becoming more common.
- Interest may rise every year around the same holiday, weather pattern, school cycle, or gifting period.
- A social trend may create a sharp burst that fades before production and shipping are complete.
- Demand may be stable while existing products receive poor reviews because they fail in one important use case.
- Search interest may grow, but the niche may already be crowded with highly rated, well-differentiated products.
These scenarios should not produce the same launch decision. A durable problem with weak existing solutions may justify product development. A predictable seasonal niche may justify a carefully scheduled inventory plan. A fast-moving novelty may require a shorter sourcing cycle—or a decision not to enter at all.
Amazon's Product Opportunity Explorer reflects this multi-signal approach. It brings together trends in searches, purchases, reviews, pricing, niche saturation, returns, and product features. Amazon also recommends examining whether products sell consistently or experience seasonal changes. The practical lesson is simple: no single chart should carry the entire launch case.
Start with a clear market-research question
Before opening a dashboard, define the decision you need the research to support. “Is this a good category?” is too broad. Better questions include:
- Is customer demand likely to remain after the current seasonal peak?
- Can we solve a repeated complaint that leading products have not addressed?
- Is there enough time to manufacture, ship, index, and learn before peak demand?
- Does the category support a meaningful feature or positioning difference?
- Are buyers dissatisfied with the product itself, or mainly with delivery and seller service?
- Should we launch a new product, add a variation, improve an existing product, or wait for more evidence?
A specific question prevents the research from becoming a collection of interesting metrics with no decision rule.
The five signals in an Amazon category-timing scorecard
Use the following five dimensions to evaluate a launch window. Score each dimension from 1 to 5, document the evidence, and add a confidence level. The score is not a forecast. It is a way to make assumptions visible and compare opportunities consistently.
| Signal | What to inspect | Strong evidence looks like | Warning signs |
|---|---|---|---|
| Demand durability | Search and purchase direction across multiple time windows | Stable or rising interest beyond one isolated event | One sharp spike with little history |
| Seasonality fit | Recurring peaks, lead time, inventory arrival, and learning period | Launch can happen before demand accelerates | Inventory arrives during or after the peak |
| Unmet customer need | Repeated complaint themes, desired outcomes, and return drivers | A specific problem appears across products and time | Complaints are rare, vague, or mostly about shipping |
| Competitive space | Niche saturation, ratings, review depth, price bands, and feature similarity | Buyers have clear needs that current offers satisfy poorly | Many established products already solve the same need well |
| Execution readiness | Product proof, supply chain, margin, compliance, listing, and support readiness | Team can deliver the promised difference before the window | The concept depends on untested claims or an unrealistic schedule |
1. Demand durability
Begin with several time horizons rather than one recent chart. Review recent movement to understand momentum, a full year to see seasonal behavior, and a multi-year view when data is available to distinguish recurring demand from a new event.
Google explains that Google Trends data is normalized by time and location and scaled from 0 to 100. That makes it useful for comparing relative interest, but it is not an absolute search-volume report. Treat it as one directional signal, then compare it with Amazon-native search and purchase behavior, your own sales data, category reports, and advertising observations.
Ask:
- Does interest return at similar times each year?
- Is the baseline growing, flat, or shrinking outside the peak?
- Do related queries point to the same underlying need?
- Is the category growing broadly, or is one product style creating most of the movement?
- Would the opportunity still be attractive if demand returned to its pre-spike baseline?
That last question is a useful stress test. If the launch case only works at the highest observed demand, the timing risk is already high.
2. Seasonality fit
Seasonality is not automatically a reason to avoid a category. It is a scheduling constraint.
Work backward from the expected demand window. Include time for product validation, manufacturing, freight, receiving, listing preparation, inventory availability, review generation within platform rules, advertising learning, and operational troubleshooting. A product that arrives at the peak has missed much of the useful launch window because the team has no time to learn before demand begins to fall.
Create three dates:
- Evidence lock date: the last date for changing the core product or positioning decision.
- Inventory-ready date: the date sellable inventory must be available.
- Learning-window start: the date campaigns, listing tests, and support workflows can begin collecting real signals.
If those dates cannot fit before the category accelerates, consider a smaller test, a later season, or a different product scope.
3. Unmet customer need
This is where review signals make Amazon market research more useful. Demand data can reveal activity, but reviews help explain the gap between what customers expected and what they received.
Do not begin by reading a few dramatic one-star reviews. Build a structured view across competitors, ratings, and time periods. Group language into themes such as durability, fit, setup, packaging, comfort, compatibility, cleaning, battery life, instructions, or giftability. Then preserve the context behind each theme:
- What was the buyer trying to accomplish?
- Which product feature or limitation caused the problem?
- How severe was the issue?
- Did the buyer keep, return, replace, or modify the product?
- Does the theme appear across several competitors?
- Is the complaint still appearing in recent reviews?
Amazon's overview of Product Opportunity Explorer notes that Customer Review Insights can aggregate sentiment for a product or niche. A dedicated voice-of-customer analysis workflow can extend this work by organizing customer needs, pain points, strengths, weaknesses, and buyer language into evidence your product and marketing teams can use.
The strongest launch signal is not “competitors have bad reviews.” It is: a defined group of buyers repeatedly describes the same important outcome, current products fail in a specific way, and your team can credibly solve that failure.
4. Competitive space
Low competition alone is not proof of opportunity. Sometimes a niche has few sellers because demand is weak, economics are poor, compliance is difficult, or the problem is expensive to solve.
Compare:
- How concentrated clicks and purchases are among leading products.
- Whether top products compete mainly on price or meaningful features.
- Review depth and rating distribution, not just average rating.
- How often the same praise and complaint themes appear across brands.
- Whether new products are gaining traction with a clear difference.
- Whether customer expectations are moving faster than existing listings.
Use competitor analysis to connect product facts with customer language. The goal is to identify a defensible entry point, not merely a less crowded keyword.
5. Execution readiness
A promising category can still be the wrong launch for your team right now. Add an execution gate before approving the timing.
Confirm that you can:
- Demonstrate the proposed product difference with tests or prototypes.
- Source and deliver inventory inside the required window.
- Maintain acceptable unit economics under realistic advertising and return assumptions.
- Meet category, safety, labeling, and intellectual-property requirements.
- Build listing content around verified benefits rather than unsupported promises.
- Prepare support responses for the questions and failure modes visible in reviews.
- Monitor early feedback and make a defined decision after launch.
This gate protects the team from confusing an attractive market with a launch-ready offer.
How to score the opportunity
Use a simple 25-point model:
| Score | Interpretation | Recommended action |
|---|---|---|
| 21–25 | Strong evidence across market, customer, and execution signals | Advance to final validation and launch planning |
| 16–20 | Promising, with one or two material uncertainties | Run a bounded test and close the evidence gaps |
| 11–15 | Mixed evidence or weak timing fit | Redesign the offer, change the window, or gather more data |
| 5–10 | Opportunity depends on fragile assumptions | Do not commit significant inventory yet |
Do not let a high score in one dimension hide a critical failure in another. A strong demand score cannot compensate for a compliance blocker. A clear complaint theme cannot compensate for a product the team cannot manufacture reliably. Add explicit “no-go” conditions alongside the numeric score.
For every dimension, record:
- The score.
- The source and date of the evidence.
- The analyst's confidence: low, medium, or high.
- The assumption most likely to be wrong.
- The next test that would reduce uncertainty.
This turns the scorecard into a decision log instead of a decorative total.
Example: separating a seasonal spike from a durable opportunity
Imagine a category where searches rise sharply before summer. The chart alone suggests an attractive launch. Review analysis, however, shows that buyers repeatedly complain about storage bulk, difficult cleaning, and failure during a specific outdoor use case.
The team now has two different opportunities:
- Capture seasonal demand with a familiar product and faster execution.
- Build a more differentiated product that solves the recurring use-case failures.
The first option may fit the current season if inventory is already near ready. The second may have a stronger long-term position but require missing the immediate peak to complete product validation. The correct timing depends on the chosen strategy—not on the demand curve alone.
This is why market insight, product research, and review intelligence should be connected. Market data identifies the window. Customer evidence defines what is worth launching into that window.
Common Amazon market research mistakes
Treating relative interest as absolute demand
Trend indexes are useful for direction and comparison. They should not be translated directly into unit forecasts. Validate them with marketplace behavior and business-specific data.
Using only recent reviews
Recent reviews show current conditions, but older periods reveal whether a complaint is persistent, seasonal, or already fixed. Compare time windows.
Counting complaints without reading context
Theme frequency matters, but a frequent low-severity annoyance may be less important than a smaller, purchase-blocking failure. Combine frequency, severity, buyer segment, and use case.
Mistaking delivery problems for product gaps
Separate product design, packaging, fulfillment, seller service, and expectation-setting issues. Each requires a different response.
Choosing the launch date before calculating lead time
Teams often identify a peak and then work forward. Instead, work backward from the customer demand window and include a learning period before it.
Copying competitor features instead of solving buyer outcomes
A longer feature list is not automatically a stronger offer. Use reviews to understand what buyers are trying to achieve and which tradeoffs they accept.
A repeatable weekly workflow
For categories under active consideration, use this cadence:
- Update demand, price, saturation, and seasonality evidence.
- Refresh competitor review themes and preserve representative examples.
- Identify which needs are persistent, emerging, declining, or resolved.
- Re-score the five timing dimensions.
- Review no-go conditions and execution dependencies.
- Decide: advance, test, wait, redesign, or reject.
- Record what changed since the previous decision.
The value comes from consistency. A repeatable process makes it easier to compare categories, challenge optimistic assumptions, and explain why a launch decision changed.
Turn market activity into a launch decision
Good Amazon market research does not produce certainty. It reduces avoidable uncertainty before the team commits resources.
Use quantitative signals to understand demand, competition, and timing. Use review signals to understand the customer problem, product gap, and language of the opportunity. Then apply an execution gate that reflects what your team can actually deliver.
VOC AI helps ecommerce teams connect market insight, product research, competitor evidence, and customer-review analysis. Instead of stopping at a product shortlist, teams can build a traceable case for what to launch, which customer need to solve, and when the evidence is strong enough to move.
Explore VOC AI Market Insight to organize market and customer signals for your next category decision.