Updated September 10, 2026.
Product research AI should not be measured by how many themes it finds, how fast it writes a summary, or how polished the dashboard looks. Those are activity metrics. They tell you the system did something, not whether the team made a better product decision.
The useful question is sharper:
Did this product research AI workflow change a decision your team can defend with evidence?
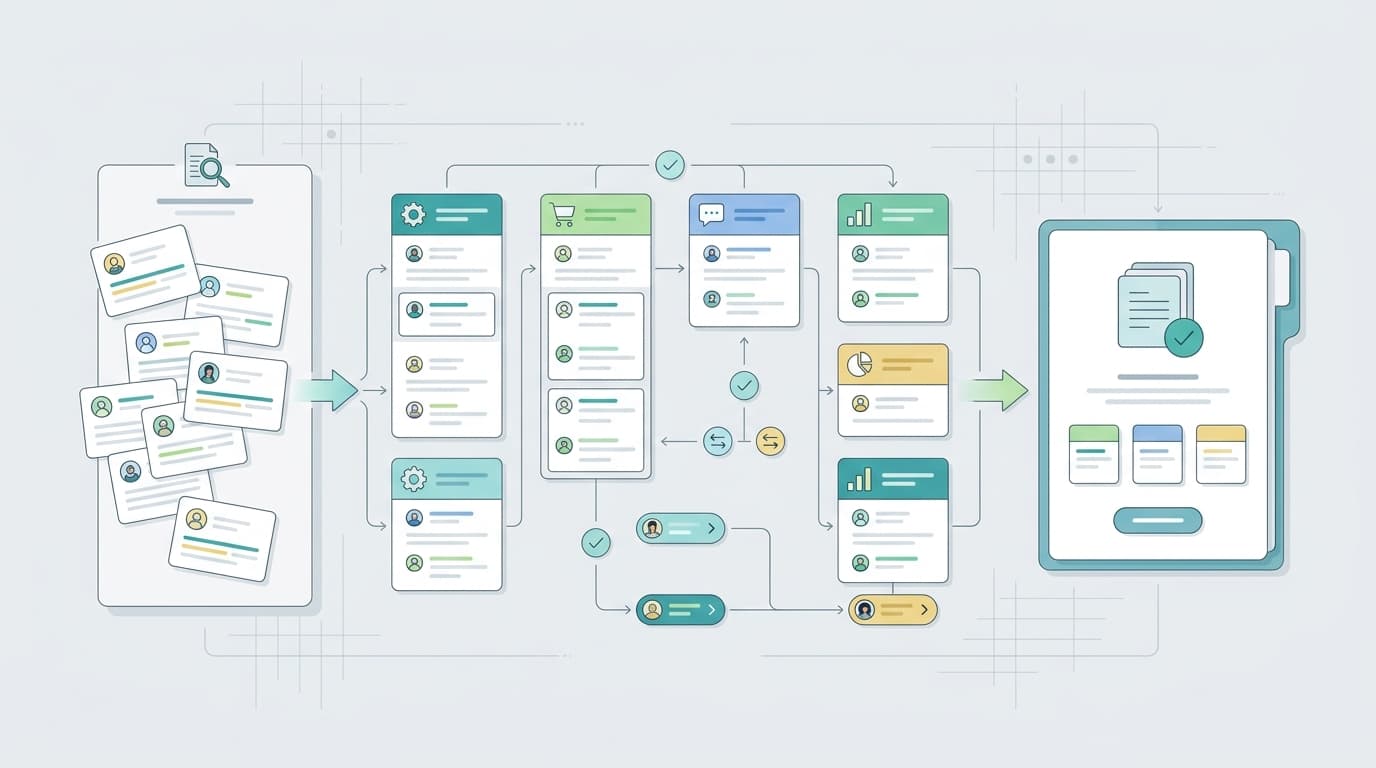
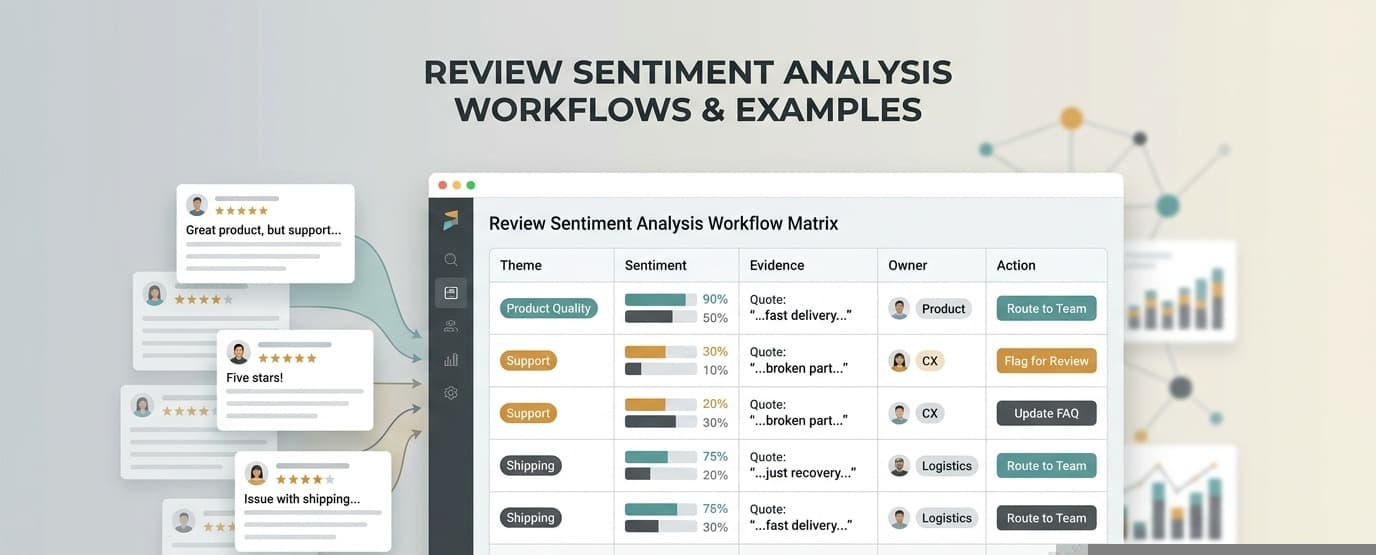
That is the standard this guide uses. The metrics below help product, ecommerce, research, growth, and founder teams measure whether product research AI is producing decision-grade work from reviews, competitor evidence, category signals, support tickets, interviews, and internal notes.
If you need the category definition first, start with what product research AI is. If you are choosing software, use the product research AI comparison and the product research AI tools evaluation framework. If you already have a workflow in motion, the product research AI practical guide covers the operating cadence. This page is narrower: it gives you the metrics that tell whether the workflow is worth keeping.
The product research AI metric stack
Use these metrics together. One number will not tell you whether product research AI is working.
| Metric | What it measures | How to calculate or inspect it | What a weak result means |
|---|---|---|---|
| Decision fitness rate | Whether outputs answer a named product decision | Accepted outputs tied to a decision sentence / total outputs reviewed | The AI is creating research artifacts without a clear job |
| Evidence coverage rate | Whether findings include enough source evidence | Findings with source examples, cohort, and counterevidence / accepted findings | Themes may be plausible but hard to defend |
| Traceability rate | Whether a teammate can inspect the source behind each claim | Major claims with links, record IDs, review examples, or export rows / major claims | The output cannot survive review by a skeptical owner |
| Cohort stability | Whether reruns use the same evidence boundary | Compare product set, competitor set, time window, market, rating band, and exclusions across runs | The answer may change because the input changed silently |
| Demand-pain separation | Whether market demand and customer pain stay distinct | Score each recommendation for separate demand evidence and pain evidence | The team may chase a loud complaint in a weak market or a hot category with no fixable problem |
| Contradiction preservation | Whether minority or conflicting evidence remains visible | Accepted findings with at least one boundary condition or counterexample / accepted findings | The AI is smoothing over segmentation signals |
| Actionability rate | Whether the output becomes a usable next artifact | Outputs that produce a PRD, listing brief, roadmap note, test plan, support macro, or no-action record / outputs reviewed | The workflow stops at summary instead of decision |
| Owner handoff completion | Whether someone accepts, rejects, or requests more evidence | Outputs with named owner and decision state / outputs routed | Findings are landing in shared docs with no operator |
| Time saved per accepted decision | Whether speed gains apply to decisions, not just drafts | Baseline research hours minus AI-assisted hours for accepted decisions only | The workflow may save writing time while adding review and repair time |
| Reuse and refresh rate | Whether the workflow repeats without starting over | Saved analyses refreshed or reused in later decisions / eligible analyses | The team is treating product research AI as one-off prompting |
| Downstream outcome linkage | Whether decisions are checked after action | AI-supported decisions with a recheck signal and result / AI-supported decisions | The team cannot learn which research signals predict useful work |
The ordering matters. Start with decision fitness, evidence coverage, traceability, and cohort stability. If those fail, later metrics become vanity numbers.
Start with a decision sentence
Before you measure product research AI, define the decision it must support:
We need to decide whether to [build, improve, launch, reposition, bundle, retire, or monitor] [specific product, feature, SKU, listing, competitor response, or category] for [customer segment or market] by [date].
That sentence is the measurement boundary. Without it, a model can produce a fluent report that nobody can accept or reject.
For example:
| Weak measurement setup | Stronger measurement setup |
|---|---|
| "Analyze reviews for this product category." | "Decide whether durability complaints justify a revised material spec for the next accessory launch." |
| "Find customer pain points." | "Decide which competitor complaint should shape the next listing update." |
| "Summarize market opportunities." | "Decide whether this category has both demand and repeated unsolved buyer frustration." |
| "Create a product research report." | "Decide whether the roadmap should prioritize setup simplification or a new bundle." |
The strong version tells you which metrics matter. You can measure evidence coverage, source traceability, owner handoff, and downstream outcome. The weak version mostly measures whether the AI wrote something.
Metric 1: Decision fitness rate
Decision fitness rate is the percentage of product research AI outputs that answer a named decision.
Use this check:
| Output question | Pass condition |
|---|---|
| Does the output name the product, category, SKU, feature, segment, or competitor in scope? | Yes, the object of the decision is explicit |
| Does it say what action is being considered? | Build, improve, launch, reposition, bundle, retire, test, or monitor |
| Does it name a decision owner? | Product, ecommerce, growth, founder, research, support, marketing, or operations |
| Does it include a deadline or review moment? | The team knows when the decision must be made |
| Does it give a recommendation plus reason? | The output does more than list themes |
Do not score a generic insight report as decision-fit just because it is interesting. Product research AI earns credit only when a team can use the output to make or reject a specific move.
Metric 2: Evidence coverage rate
Evidence coverage asks whether every accepted finding carries enough proof.
A finding should include:
- source type, such as review, competitor review, support ticket, survey answer, sales note, interview, product analytics, or market data
- cohort, including market, product set, competitor set, time window, rating band, segment, and exclusions where relevant
- representative source evidence
- theme or mechanism
- severity or business consequence
- counterevidence or boundary condition
- recommended next artifact
If a finding says "buyers dislike setup," it is not covered. If it says "first-time buyers in the last 90 days repeatedly mention confusing setup instructions in low-star reviews, while expert buyers mostly complain about missing advanced controls," the team has something to inspect.
For ecommerce and marketplace work, reviews are especially useful because they preserve buyer language. VOC.AI's Product Research page positions the workflow around review-backed demand, category signals, and buyer tradeoffs. Its Voice of Customer Analysis page frames customer reviews as evidence for product direction, buyer language, and market-ready decisions.
Metric 3: Traceability rate
Traceability rate measures whether a teammate can click, inspect, or audit the evidence behind a claim.
Track it at the claim level:
| Claim type | Minimum traceability |
|---|---|
| Review theme | Review IDs, review links, product or ASIN, rating, date range, and sample language |
| Competitor gap | Competitor product set, attribute, review evidence, rating context, and source examples |
| Market opportunity | Category, time window, demand signal, competitor context, and source route |
| Support issue | Ticket IDs or export rows, account segment, lifecycle moment, and severity |
| Interview or survey signal | Participant segment, date, question context, quote or response ID |
| API-generated output | Stable source IDs, filters, schema version, and rerun path |
Traceability is not bureaucracy. It prevents a polished AI summary from becoming a product requirement nobody can defend.
For recurring workflows, traceability needs structure. VOC.AI's Review Analysis API describes programmatic access to review, keyword, sales, and listing data through API and MCP surfaces. That is relevant when teams need product research AI outputs to flow into internal dashboards, agents, or repeatable reports.
Metric 4: Cohort stability
Cohort stability tells you whether the same question is being asked against the same evidence boundary.
Log these fields before every run:
| Cohort field | Why it matters |
|---|---|
| Product or SKU set | Prevents mixing old versions, variants, accessories, or unrelated products |
| Competitor set | Keeps comparison work from drifting toward easier or louder competitors |
| Marketplace or region | Reviews and demand can change by market |
| Time window | Old complaints can survive after a fix; new complaints may reflect a recent change |
| Rating band | One-star reviews and five-star reviews answer different questions |
| Segment or use case | Beginners, power users, budget buyers, and premium buyers often want different things |
| Exclusions | Removes irrelevant replacement parts, shipping issues, spam, and unsupported categories |
If a rerun changes the answer, check the cohort before you check the model. Many product research AI errors are input-boundary errors.
Metric 5: Demand-pain separation
Product teams need to know two different things:
- Demand: people are buying, searching, comparing, or entering the category.
- Pain: people are disappointed enough to complain, return, churn, switch, or ask for a better version.
Good product research AI keeps those scores apart until the decision meeting.
| Situation | What it means | Decision implication |
|---|---|---|
| High demand, high pain | The category is active and buyers are visibly underserved | Investigate build, fix, bundle, or reposition options |
| High demand, low pain | The category is active but the opening may be weak | Look for differentiation before investing |
| Low demand, high pain | The problem is real but may not justify a large bet | Consider a niche offer, support fix, or monitor-only decision |
| Low demand, low pain | There is little current evidence for action | Reject or revisit later |
VOC.AI's Market Insight page focuses on category movement, sales estimates, market share, competitor tracking, product research, and review signals. That market layer should not replace review evidence. It should sit beside it so the team can decide whether a painful complaint lives inside a market worth acting on.
Metric 6: Contradiction preservation
Contradiction preservation measures whether product research AI keeps inconvenient evidence visible.
Examples:
- Buyers complain a product feels heavy, but others praise the same weight as durable.
- Beginners ask for simpler controls, while expert buyers complain about missing advanced settings.
- Premium buyers dislike cheap materials, while budget buyers reject a higher price point.
- A feature is praised in five-star reviews and criticized in one-star reviews because segments use it differently.
- A competitor wins on simplicity but loses on durability.
If the output removes these contradictions, it removes the segmentation insight. Score a finding as contradiction-preserved only when it includes at least one counterexample, exception, or segment boundary.
Metric 7: Actionability rate
Actionability rate asks whether the output creates a usable next artifact.
Use this mapping:
| Finding type | Next artifact | Owner |
|---|---|---|
| Repeated defect | Defect brief with source examples and severity | Product or quality |
| Missing feature | Opportunity brief or roadmap candidate | Product |
| Listing mismatch | Listing-copy brief using buyer language | Ecommerce or marketing |
| Competitor weakness | Positioning brief or launch angle | Growth or product marketing |
| Category demand with weak pain | Monitor-only record with recheck date | Founder or category owner |
| Support confusion | Support macro, setup guide, or onboarding fix | Support, CX, or lifecycle |
| Ambiguous evidence | Follow-up interview, survey, or manual review plan | Research |
Count only outputs that turn into one of those artifacts or a clear no-action record. A clean summary with no next artifact should not pass.
Metric 8: Owner handoff completion
Owner handoff completion is simple: did someone accept, reject, or request more evidence?
Track four states:
| State | Meaning |
|---|---|
| Accepted | The owner will act on the output |
| Rejected | The owner reviewed the evidence and chose no action |
| Needs more evidence | The owner named the missing proof |
| Unowned | Nobody is responsible for the decision |
Unowned findings are not backlog. They are waste. Product research AI should reduce ambiguity, not create another queue of interesting comments.
Metric 9: Time saved per accepted decision
Most teams measure AI time savings too early. They compare "hours to draft a report" against "minutes to generate a summary." That misses the repair cost.
Measure only accepted decisions:
Time saved per accepted decision = baseline research hours - AI-assisted hours, including setup, cleanup, review, correction, owner discussion, and final artifact creation.
If a report takes 15 minutes to generate but three hours to repair, the workflow did not save three hours. It moved the work.
Metric 10: Reuse and refresh rate
Product research AI should make future decisions easier.
Track whether saved analyses can be reused:
- Can the same cohort be refreshed next month?
- Can a teammate rerun the workflow without the original prompt writer?
- Can the output become a recurring scorecard, watchlist, or product-review meeting input?
- Can the team compare "what changed" instead of starting from a blank prompt?
- Can source IDs, filters, and outputs be exported or routed into another system?
Reuse matters most when product research is not a one-time project. If your team scans reviews, competitors, categories, and support patterns every week, saved cohorts and repeatable outputs are part of the value.
Metric 11: Downstream outcome linkage
Downstream outcome linkage is the feedback loop after the team acts.
For every accepted decision, record:
| Field | Example |
|---|---|
| Decision | Prioritize setup simplification over a new bundle |
| Evidence | Recent low-star review themes, support tickets, competitor comparisons |
| Action | Update setup flow, listing copy, and support macro |
| Expected signal | Fewer setup complaints in the next review cohort |
| Recheck date | 30 or 60 days after the change |
| Result | Improved, unchanged, worsened, or inconclusive |
| Learning | Which source predicted the outcome best |
Do not overclaim causality. A product research AI output does not "prove" that a later result happened because of the recommendation. The metric only tells whether the team checked the next signal and learned from it.
Bad metrics to replace
Some metrics feel useful because they are easy to count. Replace them with decision metrics.
| Bad metric | Why it misleads | Replace with |
|---|---|---|
| Number of themes found | More themes can mean less focus | Decision fitness rate |
| Average sentiment score | Sentiment does not explain what to build or fix | Evidence coverage and actionability rate |
| Number of reviews processed | Scale alone does not prove quality | Traceability rate and cohort stability |
| Prompt count | Activity is not decision progress | Owner handoff completion |
| Dashboard logins | Usage may be passive browsing | Accepted decisions and downstream rechecks |
| Report generation speed | Fast drafts can still require heavy repair | Time saved per accepted decision |
| Number of recommendations | Recommendations without evidence create risk | Contradiction preservation and traceability |
The point is not to ignore efficiency. The point is to measure efficiency only after the evidence and decision quality are real.
A 14-day product research AI metrics pilot
Use this pilot before you decide whether the workflow deserves more investment.
| Day | Work | Output |
|---|---|---|
| 1 | Pick one product decision due in the next 30 days | Decision sentence |
| 2 | Lock the evidence cohort | Product set, competitor set, source list, time window, exclusions |
| 3-4 | Run the product research AI workflow | Draft findings with evidence |
| 5 | Audit traceability and coverage | Claim-level source check |
| 6 | Add contradiction pass | Counterevidence and segment boundaries |
| 7 | Convert findings into a next artifact | PRD, listing brief, roadmap note, test plan, support macro, or no-action record |
| 8 | Route to the owner | Accept, reject, or request more evidence |
| 9-10 | Repair only what the owner needs | Final decision packet |
| 11 | Score time saved against the baseline | Accepted-decision time calculation |
| 12 | Save cohort and workflow inputs | Rerun-ready record |
| 13 | Define downstream signal | Recheck metric and date |
| 14 | Decide whether to keep, change, or stop the workflow | Pilot scorecard |
The pilot succeeds only if the owner can make or reject a decision. If the result is a better research archive, the product research AI workflow still needs work.
Product research AI scorecard template
Use this scorecard in the pilot. Score each row from 0 to 3.
| Metric | Weight | 0 means | 3 means |
|---|---|---|---|
| Decision fitness rate | 15% | Output is not tied to a named decision | Output directly answers a decision sentence |
| Evidence coverage rate | 15% | Themes have little source context | Findings include source evidence, cohort, severity, and counterevidence |
| Traceability rate | 15% | Claims cannot be inspected | Major claims trace to source links, IDs, rows, or review examples |
| Cohort stability | 10% | Inputs drift between runs | Cohort fields are locked and rerunnable |
| Demand-pain separation | 10% | Demand and complaint signals are merged | Market demand and buyer pain are scored separately |
| Contradiction preservation | 10% | Output hides disagreement | Segment boundaries and counterexamples are visible |
| Actionability rate | 10% | Output stops at summary | Output becomes a named next artifact or no-action record |
| Owner handoff completion | 5% | Nobody accepts or rejects the finding | Owner state is recorded |
| Time saved per accepted decision | 5% | Repair cost erases speed gains | Accepted decisions take less total team time |
| Reuse and refresh rate | 3% | Workflow is one-off | Cohort and prompts can be refreshed |
| Downstream outcome linkage | 2% | No recheck is scheduled | Expected signal and recheck date are recorded |
Do not average away a zero on traceability, evidence coverage, or cohort stability. Those are blockers. A product research AI workflow that cannot show its work is not ready for serious product decisions.
How VOC.AI fits this measurement model
VOC.AI fits product research AI measurement when customer reviews, competitor evidence, marketplace context, and repeatable workflows matter.
- Use Product Research when the decision is what to build, improve, test, package, or reposition next.
- Use Market Insight when the team needs category movement, market-share context, sales estimates, competitor tracking, product research, and review signals beside the review evidence.
- Use Voice of Customer Analysis when the team needs customer review themes, buyer language, pain points, expectations, and product direction.
- Use Review Analysis API when the workflow needs structured review, keyword, sales, and listing data in internal tools, agents, or recurring reports.
- Use Pricing when the team is deciding which platform, API, or MCP path fits the pilot and recurring workflow.
That does not mean VOC.AI should be the only source in every product research AI workflow. If the decision depends on product telemetry, finance data, manufacturing constraints, offline interviews, or enterprise CRM data, connect those systems too. Use VOC.AI where buyer reviews, market context, competitor gaps, and review-backed product evidence are the missing layer.
FAQ
What metrics matter most for product research AI?
Start with decision fitness, evidence coverage, traceability, cohort stability, demand-pain separation, contradiction preservation, actionability, owner handoff, time saved per accepted decision, reuse, and downstream outcome linkage.
What is the first metric to check?
Decision fitness. If the output is not tied to a named product decision, the rest of the metrics are premature.
Should product research AI be measured by time saved?
Yes, but only after the decision is accepted. Measure total time saved per accepted decision, including setup, cleanup, review, corrections, and final artifact creation.
How do you measure evidence quality in product research AI?
Check whether each accepted finding includes source examples, source type, cohort definition, severity, counterevidence, and a path back to the underlying review, ticket, interview, survey response, or data row.
What is a bad product research AI metric?
Theme count is usually a bad metric. Ten unsupported themes are less useful than one finding with clear evidence, a named owner, a next artifact, and a recheck date.
How often should teams refresh product research AI outputs?
Refresh the output when the evidence changes or when the decision reaches its review date. For fast-moving ecommerce categories, many teams should recheck after listing changes, competitor launches, rating shifts, support spikes, or new review cohorts.
Conclusion
Product research AI metrics should measure decisions, not activity.
Start with one decision sentence. Lock the evidence cohort. Require source-backed findings. Preserve contradictions. Route the output to an owner. Measure time saved only on accepted decisions. Then recheck the downstream signal after the team acts.
That is how product research AI becomes a repeatable decision workflow instead of another fast way to create a research report.