Customer feedback intelligence fails quietly. The inbox keeps filling, themes keep appearing on slides, and teams keep discussing customers—yet nobody can answer a basic operating question: How reliably does feedback move from raw evidence to a checked decision?
That is what customer feedback workflow metrics should measure.
They should not be another collection of sentiment scores, survey response rates, or ticket counts. Those measures can describe customer experience or channel activity. They do not tell you whether your feedback system preserves evidence, routes urgent signals, completes investigations, assigns decisions, and verifies outcomes.
This customer feedback intelligence workflow playbook companion gives product, support, customer success, and research teams:
- a seven-stage feedback pipeline;
- 12 practical metrics with formulas;
- a starting SLA matrix that can be adapted to team capacity;
- a weekly scorecard;
- diagnostic rules for finding where the workflow is breaking.
The goal is not to maximize every number. The goal is to make delays, weak evidence, missing ownership, and unclosed decisions visible before the workflow becomes a theme graveyard.
Start with the workflow, not the dashboard
Before choosing metrics, define the states that evidence can move through.
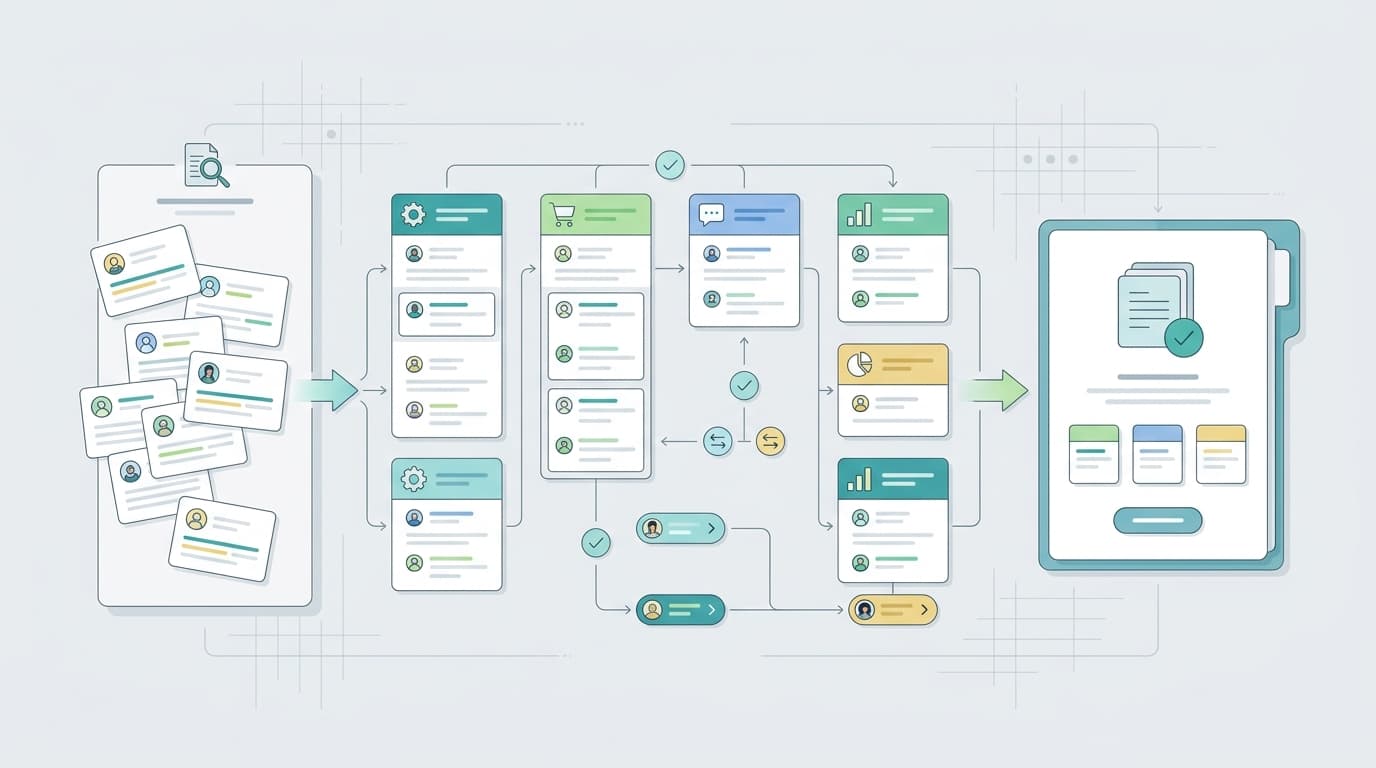
A useful minimum workflow has seven stages:
- Received: feedback enters from a review, ticket, survey, interview, call, return reason, community post, or another source.
- Traceable: the record preserves source, date, context, customer language, and a stable identifier.
- Triaged: the team assigns a lane such as monitor, investigate, respond, or escalate.
- Investigated: someone tests a specific hypothesis against supporting and contradicting evidence.
- Decided: the team records what it will do, defer, reject, or continue measuring.
- Owned: a named person has the next action and due date.
- Verified: the team checks whether the action changed the intended customer or business outcome.
The stages deliberately separate analysis from action. A comment can be traceable but not triaged. A theme can be investigated but not selected. A decision can be made but never owned. An action can ship but never be checked.
If you need the detailed mechanics behind those states, start with the customer feedback intelligence workflow playbook. Use the metrics below only after your team agrees on what each workflow state means.
The 12 customer feedback workflow metrics
Use a fixed reporting window—usually one week for flow metrics and one month or quarter for outcome metrics. Keep the denominator visible. A percentage without the underlying count can hide a nearly empty workflow.
1. Traceability rate
Question: Can a reviewer return from the insight to the original evidence?
Traceability rate = traceable feedback records / feedback records reviewed × 100
Define a record as traceable only when it includes the original source or stable source identifier, date, channel, relevant product or journey context, and preserved customer language. A generated summary alone should not pass.
Low traceability means the team is creating interpretations faster than it is creating evidence. Fix the data contract before adding more sophisticated analysis.
2. Context completeness rate
Question: Does the record contain enough context to investigate the problem?
Context completeness rate = records with all required context fields / traceable records × 100
Required context will differ by business. A SaaS team might require plan, account segment, feature, browser or device, journey stage, and outcome. An ecommerce team might require product, variant, order timing, marketplace, return status, and country.
Do not add fields because they might be useful someday. Require only the context that changes routing or investigation.
3. Time to acknowledgment
Question: How long does it take for a new signal to become visible to an accountable team?
Time to acknowledgment = acknowledged timestamp − received timestamp
Report the median and a high percentile such as the 90th percentile. The average can look healthy while a long tail of feedback sits untouched.
Acknowledgment is not resolution. It means the item entered an owned queue and is no longer invisible.
4. Time to triage
Question: How long does the team take to choose the next lane?
Time to triage = triaged timestamp − received timestamp
Segment this metric by urgency lane and source. A production-blocking complaint should not share an SLA with a low-evidence feature idea. A channel with slow intake may need automation or a clearer owner.
5. Triage SLA attainment
Question: What percentage of feedback is triaged within the target for its lane?
Triage SLA attainment = items triaged within lane target / items due for triage × 100
This is more useful than one universal response target. It lets the team protect urgent signals without pretending every comment deserves immediate investigation.
6. Triage rework rate
Question: How often is the first routing decision materially wrong?
Triage rework rate = items reassigned to a different lane / triaged items × 100
Rework is not automatically bad. New evidence should change decisions. But persistent rework can reveal ambiguous lane definitions, weak context, automation errors, or reviewers using different severity standards.
Sample reassigned items monthly. Ask whether the original decision was unreasonable at the time or whether the workflow lacked necessary evidence.
7. Investigation start rate
Question: Do items selected for investigation actually begin?
Investigation start rate = investigations started / items committed for investigation × 100
A low rate usually indicates capacity overcommitment or unclear ownership. It can also reveal that “investigate” is being used as a polite parking lot.
Limit work in progress. Five active investigations with clear owners are more useful than 40 themes labeled “research needed.”
8. Investigation cycle time
Question: How long does it take to move from a bounded question to a reviewable finding?
Investigation cycle time = finding review timestamp − investigation start timestamp
Measure this by investigation type. A same-day evidence check, a cross-channel pattern analysis, and a discovery study should not share the same target.
Cycle time becomes meaningful only when the output is defined. Require a problem statement, scope, supporting evidence, counterevidence, confidence note, and recommended next decision.
9. Counterevidence coverage
Question: How often does the investigation actively look for evidence that could weaken the preferred explanation?
Counterevidence coverage = completed investigations with documented counterevidence check / completed investigations × 100
A counterevidence check can include unaffected segments, customers who succeeded, neutral or positive comments, behavioral data that contradicts the complaint pattern, or an alternative mechanism.
This metric should not reward ceremonial text. Review a sample for quality. The point is to reduce confirmation bias, not to add another checkbox.
10. Decision conversion rate
Question: What percentage of completed investigations reach an explicit decision?
Decision conversion rate = investigations with recorded decision / completed investigations × 100
Valid decisions include act, test, defer until a trigger, reject with rationale, merge with another problem, or continue monitoring. “Shared with the team” is not a decision.
When this number is low, the problem may be governance rather than research quality. Clarify who can decide, when they decide, and what evidence the decision record requires.
11. Owner-and-date coverage
Question: Do selected actions have a named owner and a review date?
Owner-and-date coverage = accepted decisions with owner and due date / accepted decisions × 100
Avoid assigning work to a department. “Product” and “Customer Success” are not owners. Name one accountable person even when several teams contribute.
The due date can be a delivery date, experiment review, policy decision, or next evidence check. It does not have to promise a feature launch.
12. Outcome review completion
Question: Does the team return after action to test whether the expected result occurred?
Outcome review completion = actions with completed outcome review / actions whose review date has passed × 100
This is the metric that turns a feedback backlog into a learning system.
The review should compare an expected outcome with observable evidence. Examples include fewer repeat tickets for a mechanism, higher task completion, lower return reasons tied to a defect, improved adoption among the affected segment, or no meaningful change.
No change is still a result. Record it. The team may have solved the wrong mechanism, reached too few affected customers, or chosen an intervention that was too weak.
A starting customer feedback SLA matrix
An SLA is a service promise between the people who submit, route, investigate, and act on feedback. It should define the clock, the owner, the expected output, and the escalation rule.
The table below is a starting example, not an industry benchmark. Adjust it for risk, staffing, working hours, channel coverage, and the decisions your team can actually make.
| Lane | Typical signal | Acknowledge | Triage | Next owned step | Required output |
|---|---|---|---|---|---|
| Critical | Active harm, security or privacy concern, widespread outage, dangerous product behavior | 30 minutes | 2 hours | Same business day | Escalation record, incident owner, evidence link |
| High | Repeated blocker, severe workflow failure, churn or return mechanism with current exposure | 4 business hours | 1 business day | 2 business days | Scoped investigation owner and question |
| Standard | Recurring friction, confusing experience, segment-specific complaint pattern | 2 business days | 5 business days | 10 business days | Monitor, investigate, respond, or defer decision |
| Monitor | Low-frequency request, weakly supported idea, isolated preference | 5 business days | Monthly review | If threshold is met | Evidence record and explicit monitoring trigger |
Three rules keep the SLA useful:
- Stop the clock only for a defined reason. Waiting for missing context, a customer reply, or another team should have a visible status.
- Do not use urgency to skip evidence. Critical items may need immediate containment, but the original source and decision trail still matter.
- Separate service time from delivery time. The feedback team can promise triage and ownership. It usually cannot promise when a product change will ship.
Build a weekly customer feedback scorecard
Keep the scorecard short enough to review in 15 minutes. A practical version contains counts, rates, time percentiles, and exceptions.
| Workflow stage | Count entering | Count exiting | Core metric | Exceptions to review |
|---|---|---|---|---|
| Received → Traceable | Traceability rate | Missing source or context | ||
| Traceable → Triaged | Triage SLA attainment | Overdue high-risk items | ||
| Triaged → Investigating | Investigation start rate | Committed but unowned work | ||
| Investigating → Decided | Cycle time; decision conversion | Findings waiting for governance | ||
| Decided → Owned | Owner-and-date coverage | Department-only ownership | ||
| Owned → Verified | Outcome review completion | Past-due learning checks |
Add three short notes:
- What became newly urgent?
- Where is work accumulating?
- What did the team learn from a completed outcome review?
For meeting structure and role assignments, use the weekly customer feedback workflow. For evidence records, triage notes, investigation briefs, and decision records, use the customer feedback workflow templates.
Diagnose the bottleneck from the metric pattern
One metric rarely explains the problem. Read the pattern across stages.
High intake, low traceability
The team is collecting more than it can structure. Reduce required sources temporarily, improve ingestion fields, or sample strategically. Do not solve this by generating more summaries.
Healthy triage speed, high rework
The team is moving fast but inconsistently. Tighten lane definitions, add examples at boundary cases, and calibrate reviewers on the same sample.
High investigation starts, long cycle time
Work in progress is too high, questions are too broad, or the expected output is unclear. Set investigation classes and timeboxes. Require a bounded mechanism question before work begins.
Completed investigations, low decision conversion
The system lacks a decision forum or decision authority. Add a scheduled governance point and record act, test, defer, reject, or monitor explicitly.
Strong decision rate, weak owner coverage
The meeting is producing agreement without commitment. Assign one accountable person and a next date before the item can leave the decision stage.
High action completion, low outcome review
The organization rewards shipping but not learning. Schedule the review when the action is accepted, define the expected signal, and put overdue reviews on the weekly scorecard.
What not to use as a workflow success metric
Some common numbers are useful context but poor measures of workflow health.
Total feedback volume
More feedback can reflect growth, a broken experience, a new collection campaign, channel changes, or duplicate complaints. Volume alone does not show whether the system is working.
Average sentiment
Sentiment can support exploration, but it collapses mechanism, segment, context, and stakes. A mild wording pattern can hide a severe blocker, while strong language can describe an isolated preference.
Number of themes
Theme counts often increase when taxonomies drift or tools create near-duplicates. Rewarding more themes can make the system harder to use.
Number of roadmap items attributed to feedback
Not every good decision should become a feature. A response may be documentation, support enablement, policy clarification, onboarding, positioning, a reliability fix, or a deliberate decision not to act.
Percentage of feedback “closed”
This becomes gameable unless closure has a precise meaning. Distinguish acknowledged, responded, decided, acted, and outcome reviewed.
How AI should affect the scorecard
AI can classify, cluster, summarize, retrieve examples, and flag possible urgency. It can reduce handling time. It can also hide missing evidence or create confident categories that reviewers accept too quickly.
When AI participates in the workflow, add three controls:
- Evidence-link coverage: every generated theme or summary should link to reviewable source records.
- Human override rate: monitor how often reviewers materially change AI routing or labels, then inspect why.
- Segment quality checks: sample performance across channels, languages, products, and customer segments rather than relying on one aggregate accuracy number.
The NIST AI Risk Management Framework emphasizes measurement, documentation, transparency, accountability, and ongoing monitoring. Applied here, that means the AI step should be observable inside the workflow—not treated as a black box that turns comments into truth.
A four-week rollout plan
Do not launch all 12 metrics across every source at once.
Week 1: define states and evidence
- Choose one feedback source and one accountable team.
- Define the seven workflow states.
- Agree on the minimum evidence record.
- Baseline traceability, context completeness, and current queue size.
Week 2: add triage service levels
- Define four or fewer routing lanes.
- Set starting acknowledgment and triage targets.
- Record time to acknowledgment, time to triage, and rework.
- Review the oldest and highest-risk exceptions.
Week 3: measure investigation and decisions
- Define investigation output and timebox classes.
- Limit investigations in progress.
- Add counterevidence coverage and decision conversion.
- Use a clear prioritization method when several validated problems compete. The guide on how to prioritize customer feedback provides a decision-focused scoring model.
Week 4: close the learning loop
- Require owner-and-date coverage for accepted actions.
- Schedule outcome reviews when decisions are made.
- Publish the first weekly scorecard.
- Remove any metric that does not change a decision or reveal a bottleneck.
The GOV.UK Service Manual recommends choosing performance measures that help teams understand whether a service is achieving its intended outcomes. Use the same discipline here: every workflow metric should trigger a question, a decision, or a correction.
Frequently asked questions
What is the most important customer feedback workflow metric?
Start with traceability rate. If the insight cannot return to original evidence and context, faster triage or more automation will only move weak interpretations through the system faster. Once traceability is stable, outcome review completion is the strongest test of whether the workflow creates learning.
Should customer feedback have an SLA?
Yes, but the SLA should cover acknowledgment, triage, ownership, and escalation—not promise that every request will be implemented. Use different targets for active harm, repeated blockers, recurring friction, and low-evidence ideas.
How many workflow metrics should a small product team track?
Begin with five: traceability rate, triage SLA attainment, investigation cycle time, owner-and-date coverage, and outcome review completion. Add a metric only when the team can name the decision it will influence.
How do we measure feedback that does not become a roadmap item?
Record an explicit disposition: respond, monitor, investigate, test, defer until a trigger, reject with rationale, merge into another problem, or address through a non-product intervention. Workflow quality is about accountable decisions, not maximizing feature output.
What belongs on a customer feedback dashboard?
Show stage counts, conversion between stages, time percentiles, SLA attainment, overdue exceptions, and completed outcome reviews. Keep customer-experience outcomes separate from workflow-health measures, then connect them at the decision record. See the practical customer feedback dashboard guide for a cross-functional layout.
Turn the scorecard into an operating habit
The best customer feedback workflow metrics do not make the dashboard look complete. They make unfinished thinking and unowned work difficult to ignore.
Start with one source, one team, and five measures. Preserve the evidence. Route by risk. Limit investigations. Record decisions. Assign an owner and a date. Return to the outcome.
If your current process stops at clustering comments or producing summaries, Voice of Customer Analysis can help organize feedback across sources while preserving the connection between themes and customer evidence. The operating discipline still belongs to your team: decide what each state means, which service levels matter, and what proof will count as learning.