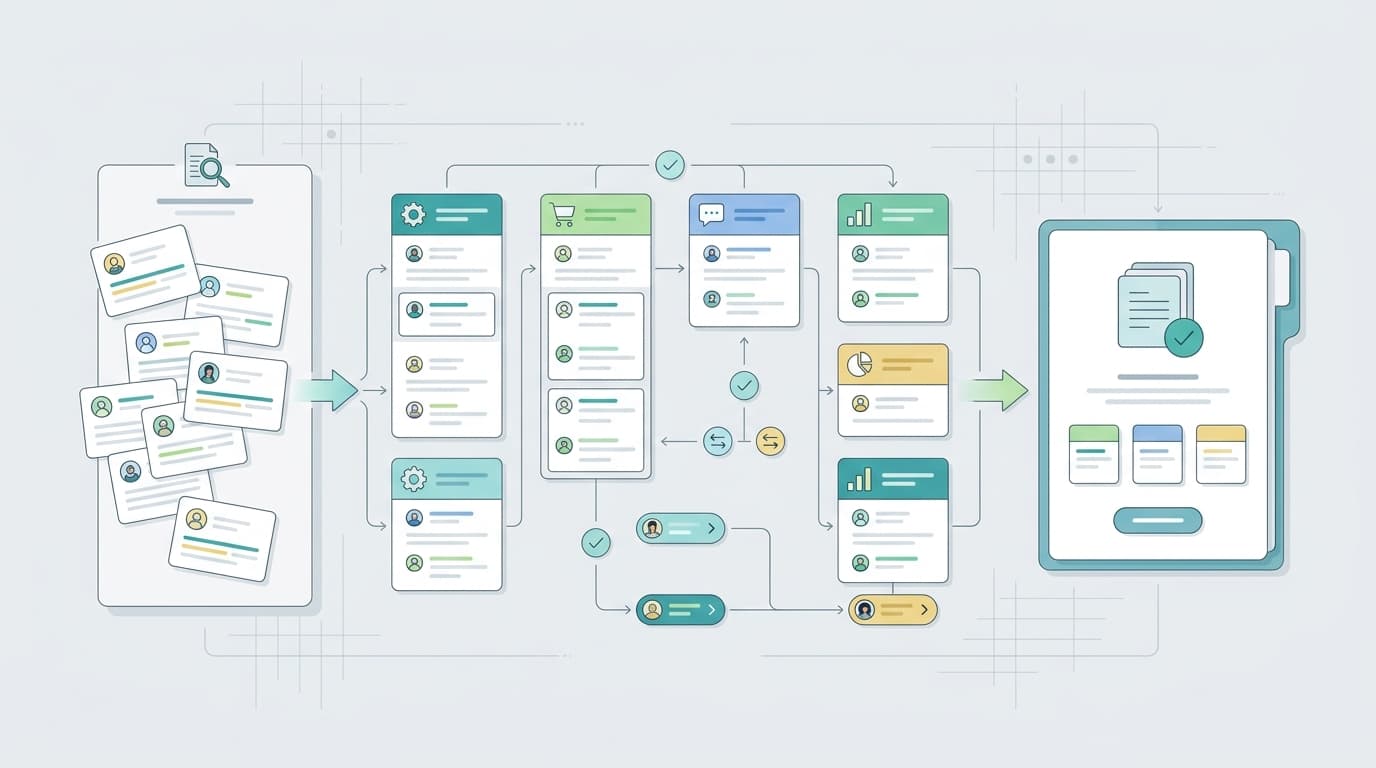
Product review mining can save research time, reduce repeated analysis, and help teams make faster product decisions. But those benefits do not make every platform, API, or automation project a good investment.
A useful business case needs more than a subscription price and an optimistic revenue estimate. It should compare the current workflow with the proposed workflow, include the full operating cost, separate observable savings from speculative upside, and show how sensitive the result is to the assumptions.
This product review mining ROI calculator gives you a copyable model for doing that. It is designed for product managers, ecommerce operators, research leaders, support teams, and technical buyers comparing manual analysis, spreadsheets, AI-assisted workflows, dedicated software, or an API.
If you first need to map every cost category, use the broader product review mining cost and ROI guide. This article focuses on building and testing the calculator itself.
The five outputs your calculator should produce
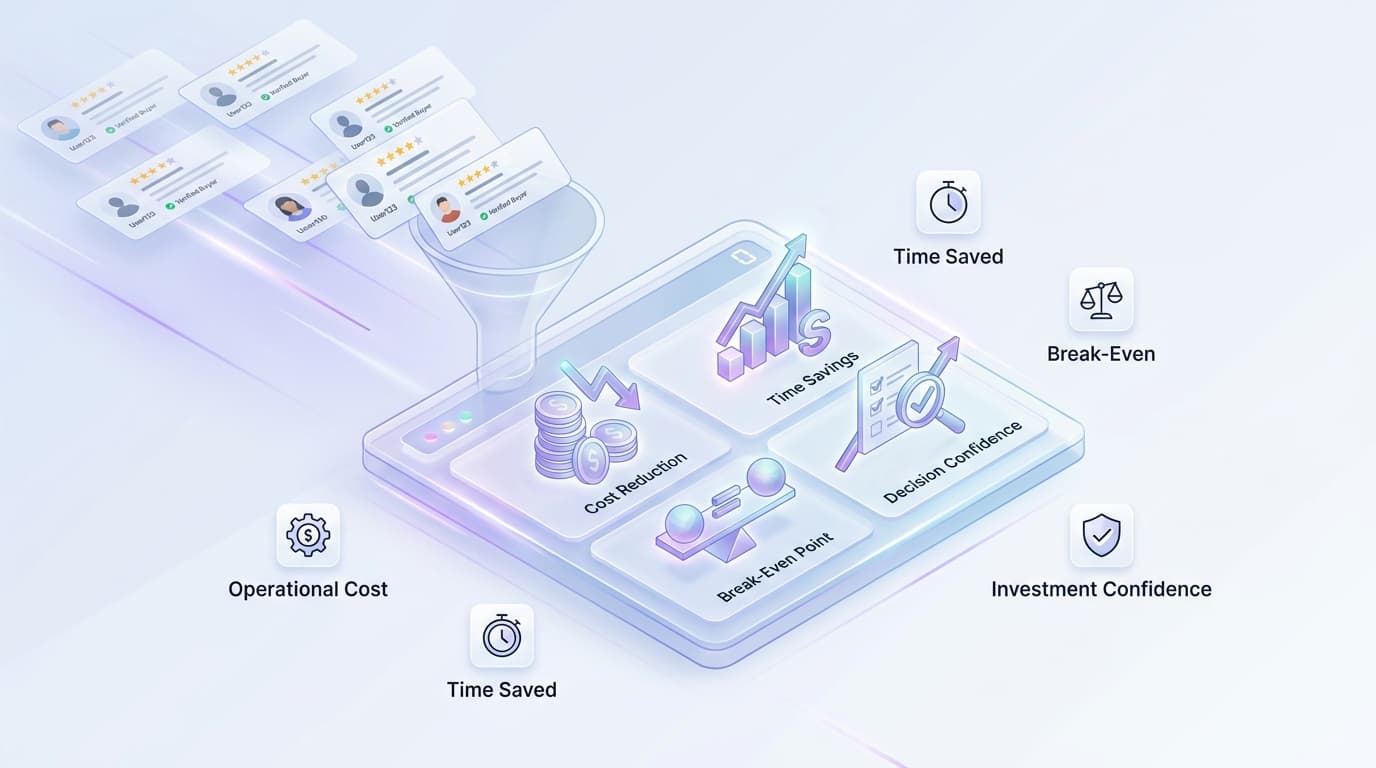
Do not begin with a single ROI percentage. Build a model that produces five outputs:
- Current monthly workflow cost: what the team spends now to collect, clean, analyze, validate, and report review evidence.
- Proposed monthly workflow cost: the recurring cost after introducing a new tool or process.
- Monthly operating benefit: current cost minus proposed cost, plus only the avoided costs you can support.
- Payback period: the time required for recurring benefit to recover one-time implementation cost.
- Cost per completed decision: the total workflow cost divided by decisions that actually received usable evidence.
The fifth output prevents a common mistake. A faster pipeline is not valuable if it produces more dashboards but does not help anyone make a decision.
Step 1: define one repeatable decision
A calculator becomes unreliable when the scope is “all customer insights.” Choose one recurring decision with a stable output.
Examples include:
- a monthly product-quality review;
- a competitor weakness brief before roadmap planning;
- a quarterly price-value analysis;
- a listing-copy evidence brief;
- a packaging complaint monitor;
- a feature-request synthesis for one product line.
Define the unit of work in one sentence:
For one decision cycle, we analyze a defined review corpus and deliver an evidence brief with themes, source links, counterexamples, and recommended validation steps.
That sentence sets the denominator for hours, cost, output quality, and throughput.
Step 2: enter the baseline inputs
Use observed data from recent comparable cycles. If you have no baseline, time the next two or three cycles before approving a large purchase.
Current-workflow input table
| Input | Symbol | What to include |
|---|---|---|
| Collection hours | Hc |
Exporting, scraping through approved access, combining files, and deduplication |
| Preparation hours | Hp |
Language filtering, spam checks, normalization, and taxonomy setup |
| Analysis hours | Ha |
Coding, clustering, comparison, interpretation, and writing |
| QA hours | Hq |
Source checks, contradiction review, sampling, and corrections |
| Reporting hours | Hr |
Building the brief, meeting preparation, and stakeholder revisions |
| Loaded hourly cost | R |
Salary, benefits, contractor cost, or the finance-approved labor rate |
| Current software and data | Sc |
Recurring tools, exports, storage, model use, and data access |
| Rework cost | Rc |
Correcting unsupported findings, rebuilding analysis, and repeated requests |
| Decision cycles per month | D |
Comparable completed cycles, not dashboards opened |
Calculate total labor hours per decision:
Current hours per decision = Hc + Hp + Ha + Hq + Hr
Then calculate the current monthly cost:
Current monthly cost = (Current hours per decision × R × D) + Sc + Rc
Use loaded cost consistently. Mixing salary-only rates for the current workflow with contractor or vendor rates for the proposed workflow will bias the comparison.
Step 3: enter the proposed-workflow inputs
The proposed workflow still needs human work. Automation may reduce collection, cleanup, or first-pass coding, but teams still need scoping, quality control, interpretation, and decision ownership.
| Input | Symbol | What to include |
|---|---|---|
| Proposed hours per decision | Hn |
All remaining collection, analysis, QA, reporting, and administration |
| Loaded hourly cost | R |
Use the same method as the baseline |
| Recurring platform cost | Sp |
Subscription, usage, seats, storage, data, and model charges |
| Recurring maintenance | Mp |
Taxonomy updates, integration monitoring, prompt or rule maintenance, and training |
| Expected rework cost | Rn |
Corrections, reruns, and stakeholder revisions after implementation |
| One-time implementation cost | I |
Setup, migration, integration, security review, training, and process design |
| Decision cycles per month | D |
Keep scope comparable to the baseline |
Calculate the proposed monthly cost:
Proposed monthly cost = (Hn × R × D) + Sp + Mp + Rn
If the new workflow increases the number of decisions the team can support, model that separately. Do not quietly compare four current decisions with ten proposed decisions and call the entire cost difference “savings.”
Step 4: calculate operating benefit, ROI, and payback
Start with operational economics because they are easier to observe than revenue attribution.
Monthly operating benefit = Current monthly cost − Proposed monthly cost
For a first-year view:
Year-one net benefit = (Monthly operating benefit × 12) − I
Year-one ROI = Year-one net benefit ÷ (Proposed monthly cost × 12 + I) × 100
If monthly operating benefit is positive:
Payback period in months = I ÷ Monthly operating benefit
If monthly operating benefit is zero or negative, there is no operational payback under the current assumptions. The project may still be justified by risk reduction, capacity, or an attributable business outcome, but that case should be shown explicitly rather than hidden inside the labor calculation.
A worked calculator example
The following values are illustrative, not a benchmark.
Assume a team completes four comparable review-mining decisions per month. The current workflow requires:
- 6 hours for collection and preparation;
- 10 hours for analysis;
- 4 hours for QA and reporting;
- a loaded labor rate of $70 per hour;
- $250 per month in existing software and data;
- $350 per month in average rework.
The current monthly cost is:
Current hours per decision = 6 + 10 + 4 = 20
Current monthly cost = (20 × $70 × 4) + $250 + $350
Current monthly cost = $6,200
Now assume the proposed workflow requires 9 hours per decision, $1,200 per month in platform and data cost, $300 in maintenance, $140 in rework, and $4,500 in one-time implementation cost.
Proposed monthly cost = (9 × $70 × 4) + $1,200 + $300 + $140
Proposed monthly cost = $4,160
Monthly operating benefit = $6,200 − $4,160 = $2,040
Year-one net benefit = ($2,040 × 12) − $4,500 = $19,980
Year-one ROI = $19,980 ÷ (($4,160 × 12) + $4,500) × 100
Year-one ROI ≈ 36.7%
Payback period = $4,500 ÷ $2,040 = 2.2 months
The model is useful because every assumption is visible. A buyer can now ask whether nine hours per decision is realistic, whether maintenance is understated, or whether the four monthly decisions are genuinely comparable.
Add cost per completed decision
Calculate unit economics for both workflows:
Current cost per decision = Current monthly cost ÷ Current completed decisions
Proposed cost per decision = Proposed monthly cost ÷ Proposed completed decisions
Use completed decisions, not reports generated. Define completion as delivery of evidence that meets your quality standard and is accepted by the decision owner.
If the proposed workflow lowers monthly cost but also produces weaker evidence, the unit-cost improvement may be false. Track at least:
- percentage of priority findings linked to source reviews;
- percentage checked for counterevidence;
- number of corrections after stakeholder review;
- percentage of briefs used in a documented decision;
- time from approved question to accepted evidence brief.
Build a three-case sensitivity analysis
A single forecast creates false precision. Build conservative, expected, and optimistic cases by changing only the assumptions with real uncertainty.
| Assumption | Conservative | Expected | Optimistic |
|---|---|---|---|
| Proposed hours per decision | 13 | 9 | 7 |
| Monthly maintenance | $500 | $300 | $200 |
| Monthly rework | $350 | $140 | $70 |
| Completed decisions per month | 3 | 4 | 5 |
Keep platform price, labor rate, and implementation cost constant unless those values are genuinely uncertain.
Then calculate monthly benefit and payback for each case. A robust purchase should not depend on every assumption landing in the optimistic column.
Use the conservative case as the approval gate when:
- integration effort is unclear;
- review data comes from multiple markets or languages;
- taxonomy and governance requirements are immature;
- adoption depends on several teams;
- the proposed workflow has not been tested on representative data.
Calculate the break-even labor reduction
Buyers often ask, “How many hours must this save to justify the recurring cost?” Use this formula:
Required monthly hours saved =
(Sp + Mp + Rn − Sc − Rc) ÷ R
If the proposed recurring non-labor cost is $1,640, the current software and rework cost is $600, and loaded labor costs $70 per hour:
Required monthly hours saved = ($1,640 − $600) ÷ $70
Required monthly hours saved = 14.9 hours
Across four monthly decisions, the workflow must save about 3.7 hours per decision merely to break even on recurring operating cost. One-time implementation cost is recovered after that threshold is exceeded.
This question is often more actionable than “What ROI will AI deliver?”
Keep revenue upside in a separate evidence layer
Review mining can inform product changes, listing updates, pricing investigations, support interventions, or market opportunities. It does not by itself prove that any of those actions caused a revenue change.
Add downstream benefit only when you document:
- the review-derived finding;
- the intervention that followed;
- the affected product, segment, or market;
- the measurement window;
- the experiment or comparison method;
- other changes that could explain the result.
Then show operational ROI and attributable business ROI as separate rows. This protects the business case from collapsing when a large but weakly supported revenue assumption is challenged.
For workflows that turn review evidence into product experiments, use the review mining for product development process. For price-value hypotheses, use review mining for pricing.
Add a confidence score to every assumption
Mark each calculator input as high, medium, or low confidence.
- High confidence: observed in finance records, time logs, contracts, or repeated completed cycles.
- Medium confidence: based on a small pilot or a closely comparable workflow.
- Low confidence: based on a vendor demo, stakeholder estimate, or untested adoption assumption.
Do not average confidence scores into a decorative number. Use them to decide what the pilot must measure. The highest-impact, lowest-confidence assumption should become the first test.
For example, if the model requires analysis time to fall from 20 hours to 9 hours per decision, run a representative pilot that measures all human time, including setup, QA, corrections, and reporting.
Governance costs belong in the calculator
Quality and governance are not optional overhead. They are part of the production workflow.
The NIST AI Risk Management Framework organizes AI risk work around governance, mapping, measurement, and management. In a review-mining workflow, practical controls can include source traceability, scope metadata, sampling, contradiction review, access controls, and human sign-off for consequential decisions.
Online reviews are also self-selected evidence. A review corpus can reveal language, events, conditions, and hypotheses, but theme frequency in that corpus is not automatically customer-population prevalence. Preserve source, date range, market, product, rating, language, and inclusion rules.
If customer language will appear in advertising or public claims, treat that as a separate governance workflow. The US Federal Trade Commission’s Consumer Reviews and Testimonials Rule Q&A provides current federal guidance on practices involving reviews and testimonials. This calculator is not legal advice.
A copyable approval worksheet
Use this compact table in a spreadsheet or procurement memo.
| Calculator field | Current | Proposed | Confidence | Evidence source |
|---|---|---|---|---|
| Hours per completed decision | ||||
| Completed decisions per month | ||||
| Loaded hourly cost | ||||
| Monthly software and data | ||||
| Monthly maintenance | ||||
| Monthly rework | ||||
| One-time implementation | ||||
| Monthly operating benefit | Formula | |||
| Cost per completed decision | Formula | |||
| Payback period | Formula | |||
| Year-one ROI | Formula | |||
| Findings with source links | QA sample | |||
| Briefs used in decisions | Decision log |
Approve a pilot, not a forecast, when critical inputs are low confidence.
When VOC AI fits the model
VOC AI’s Voice of Customer Analysis organizes ecommerce review evidence around customer profiles, purchase motivations, usage scenarios, sentiment, product strengths, weaknesses, and customer language. Evaluate it against the same calculator as any other option: total workflow cost, time per accepted decision, evidence quality, maintenance, adoption, and payback.
For category and opportunity work, pair the calculator with review mining for market research. If differences between customer contexts may explain the pattern, use review mining for customer segmentation before assuming one finding applies to everyone.
Frequently asked questions
What costs should a product review mining ROI calculator include?
Include data access, collection, preparation, analyst labor, software, model usage, storage, QA, governance, integration, training, maintenance, rework, and one-time implementation. Compare the full current and proposed workflows over the same scope.
Should revenue lift be included in review mining ROI?
Only when the review-derived finding, intervention, measurement window, and attribution method are documented. Keep labor and operational return separate from downstream business outcomes.
What is the best denominator for review mining unit cost?
Use completed decisions that received accepted evidence. Review count, dashboard views, or generated summaries can reward output volume without measuring decision usefulness.
How many cycles should a pilot measure?
Use multiple comparable cycles whenever possible. One unusually easy or difficult project can distort labor savings, rework, and cycle-time estimates.
What if the calculator shows negative ROI?
Keep the current workflow, narrow the use case, reduce implementation scope, or test whether a different recurring decision creates more value. Negative ROI is useful if it prevents an oversized commitment.
How should teams compare software with an internal build?
Use the same inputs. An internal build must include engineering, infrastructure, data access, model use, monitoring, maintenance, security review, analyst QA, and opportunity cost—not only initial development hours.
The bottom line
A defensible product review mining ROI calculator does four things well:
- compares equivalent current and proposed workflows;
- uses observable operational value before speculative revenue;
- tests uncertain assumptions with sensitivity analysis;
- connects cost reduction to accepted decisions and evidence quality.
Start with one repeatable decision. Measure the baseline. Calculate break-even hours. Run conservative, expected, and optimistic cases. Then use a representative pilot to replace estimates with observed data.