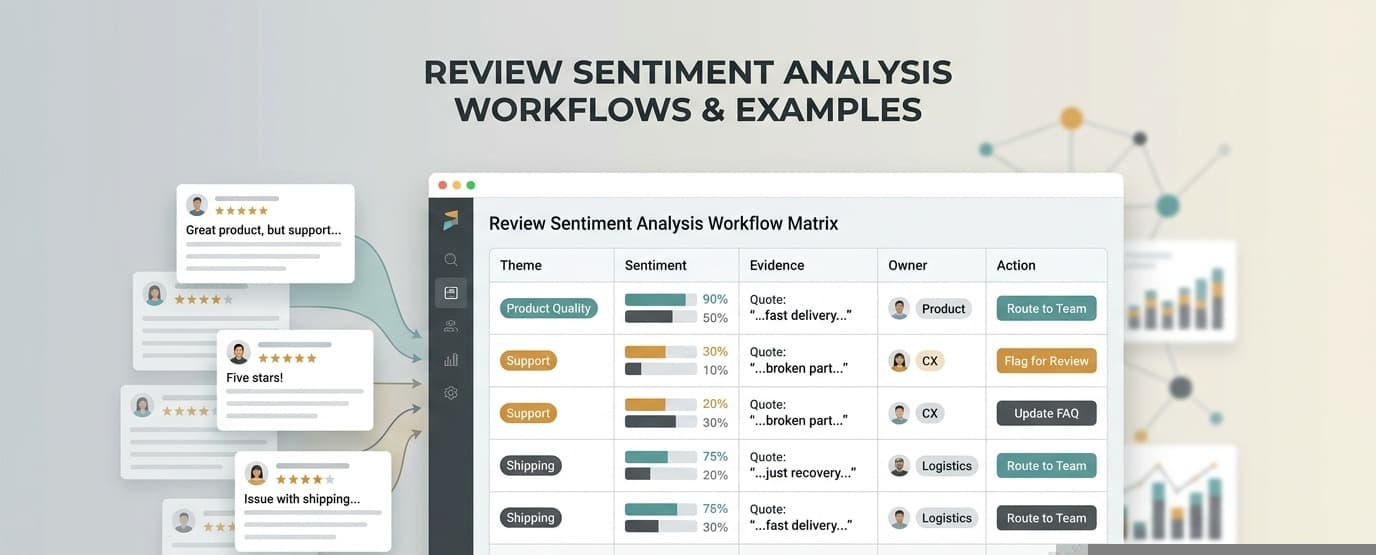
Product Review Mining: Cost and ROI Guide for a Defensible 2026 Business Case
Updated August 12, 2026.
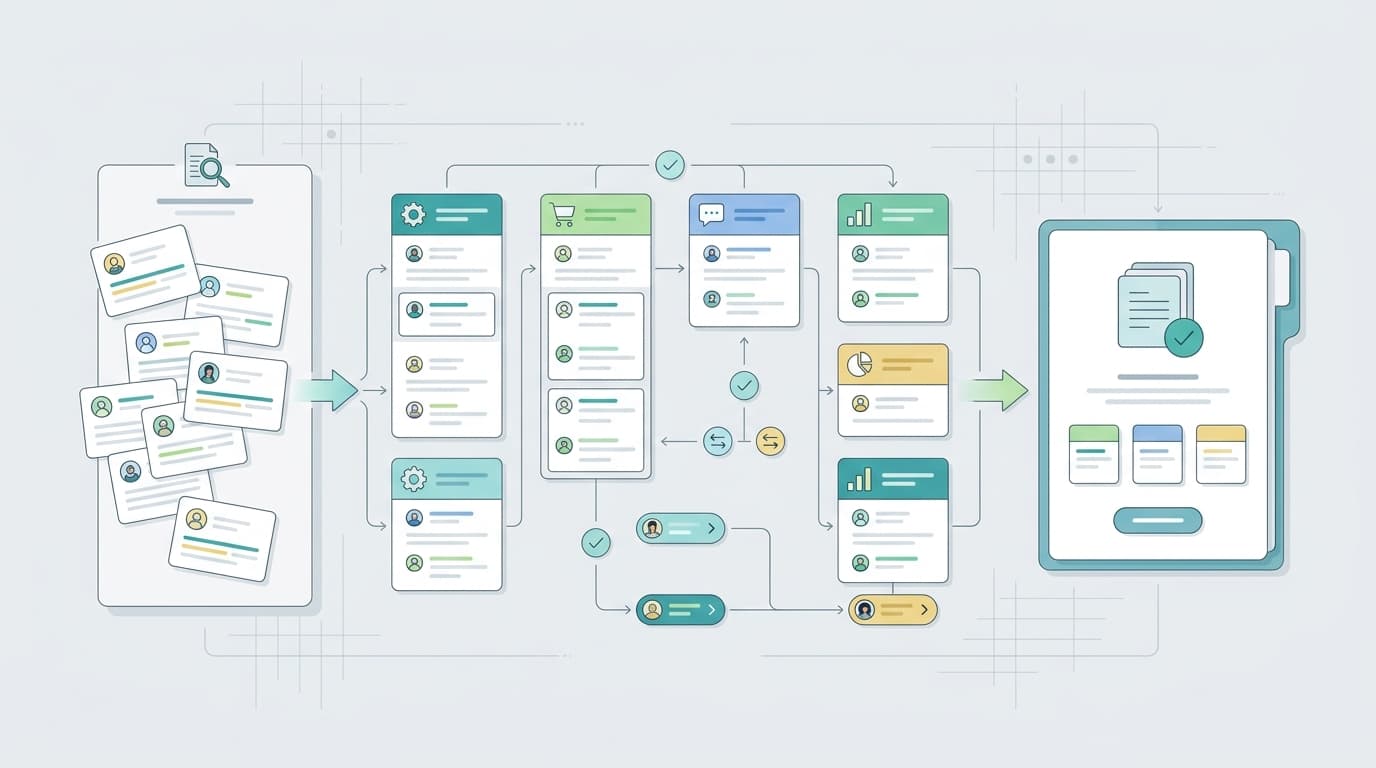
Product review mining is easy to underestimate. “Export reviews, summarize themes, share a deck” sounds like a small project. A production workflow also needs permitted data access, normalization, quality checks, source traceability, stakeholder review, integration, monitoring, and a clear path from evidence to a business decision.
This product review mining: cost and ROI guide gives you a finance-ready way to compare manual analysis, AI-assisted workflows, dedicated software, managed services, and custom systems. It also shows how to calculate payback without inventing revenue lifts or treating review frequency as market prevalence. The August 12 update keeps the 12-month build-versus-buy-versus-managed-service model and adds a 30-day proof ledger for cost variance, adoption leakage, and exitability so finance, product, procurement, and the decision owner can see which assumptions still need proof before a larger commitment.
If you only need the spreadsheet logic, use the product review mining ROI calculator. Use this guide when you need to decide which costs and benefits belong in the business case—and which claims should stay out.
Use this product review mining: cost and ROI guide as the operating document for budget conversations, not as a promise that review analysis automatically creates revenue. The goal is to make costs, evidence quality, adoption, attribution, and decision ownership visible enough that a team can approve, resize, pilot, or stop the workflow with less ambiguity.
Product review mining cost: the short answer
The cost is not determined by review count alone. It is determined by the scope, recurrence, evidence standard, number of decisions supported, and operating model.
| Operating model | Cash cost | Internal labor | Setup burden | Best fit |
|---|---|---|---|---|
| Manual reading and spreadsheets | Low | High | Low | One-time, narrow investigations |
| Exports plus scripts or general AI | Low to moderate | Moderate | Moderate | Technical teams with bounded recurring work |
| Dedicated review-mining platform or API | Moderate to high | Low to moderate | Moderate | Recurring analysis across products, competitors, or teams |
| Custom internal pipeline | High | Moderate after launch | High | Large-scale proprietary workflows with engineering ownership |
The least expensive option for one project may become the most expensive option when repeated every week. Compare total cost per completed decision, not subscription price alone.
The rest of this product review mining: cost and ROI guide uses that decision denominator consistently so every model can be compared against the same business outcome.
Start with one decision and one unit of value
ROI becomes vague when the goal is “get more customer insights.” Start with a decision that has an owner, deadline, evidence standard, and observable outcome.
Examples:
- Which product defect should enter root-cause investigation first?
- Which competitor weakness is common and specific enough to test?
- Which packaging complaint should trigger a supplier review?
- Which customer segment has a distinct unmet need?
- Which price objection reflects missing value rather than price sensitivity?
- Which listing claim needs stronger evidence or clearer language?
Use this statement:
We will analyze [defined review set] to help [decision owner] choose [specific action] by [date], using [evidence standard].
Then define the unit you will use to compare workflows:
Cost per completed decision = total workflow cost / number of decisions delivered to the agreed evidence standard
This is better than cost per review. Processing more reviews does not create value if the team produces more themes but no better decision.
The eight cost buckets in a complete review-mining budget
A vendor plan or model-usage estimate covers only part of the real cost. Include these eight buckets in both the current-state and proposed-state model.
1. Data acquisition and permitted access
Budget for:
- platform exports, APIs, approved connectors, or licensed datasets;
- engineering work needed to collect or refresh data;
- storage, transfer, and retention;
- duplicate handling across sources;
- source changes and connector maintenance;
- legal or policy review for the intended collection method.
Publicly visible text is not automatically free to operationalize. Collection failures, missing fields, variation mapping, and source-policy changes create work even when the reviews can be read in a browser.
2. Data preparation
Raw review data often needs:
- product, SKU, ASIN, variation, market, and competitor mapping;
- date, rating, language, and currency normalization;
- translation rules;
- duplicate, spam, and irrelevant-content handling;
- documented inclusion and exclusion criteria;
- review-level identifiers and source links;
- privacy controls where personal information may appear.
Preparation is not clerical overhead. It determines whether analysts can reproduce a result, correct a mistaken theme, and explain which evidence was included.
3. Analysis labor
Count every human hour required to produce a usable result:
- framing the question;
- designing the taxonomy or codebook;
- configuring prompts, filters, and queries;
- coding or classifying reviews;
- checking generated themes and summaries;
- investigating contradictions and edge cases;
- separating product, fulfillment, seller, support, and shipping issues;
- preparing evidence for stakeholders.
Use a burdened hourly rate, not base salary alone. If your finance team has an approved labor rate, use it. Otherwise document the rate and what it includes.
4. Quality assurance and governance
AI-assisted analysis still requires controls. Budget for:
- validation samples and analyst review;
- source traceability;
- confidence or uncertainty labeling;
- counterexample searches;
- taxonomy versioning;
- access control and retention policy;
- model or prompt change review;
- escalation rules for sensitive or high-impact findings.
The NIST AI Risk Management Framework emphasizes ongoing governance, measurement, and management rather than treating risk review as a one-time setup task. In review mining, that means evidence quality and workflow controls belong in operating cost.
5. Software and model usage
Include:
- subscriptions and seat costs;
- usage-based model, API, or processing fees;
- translation and enrichment services;
- data volume or storage charges;
- premium connectors;
- overage risk;
- contract minimums;
- sandbox, testing, or non-production environments.
Model fees can be smaller than the labor required to make outputs reliable. Do not optimize token cost while ignoring repeated analyst review and rework.
6. Integration and change management
The workflow has little value if findings remain in a separate dashboard. Include:
- implementation and configuration;
- SSO, security, and procurement review;
- connections to a roadmap, ticketing, research repository, or support system;
- templates and operating procedures;
- training and onboarding;
- stakeholder adoption;
- migration from the current workflow.
For a recurring cross-team process, adoption is part of the system—not a free benefit that appears after purchase.
7. Ongoing operations
After launch, budget for:
- scheduled refreshes;
- failed-job monitoring;
- source-schema changes;
- taxonomy updates;
- exception handling;
- user support;
- periodic quality audits;
- model or vendor changes;
- decommissioning and export requirements.
Custom builds often look attractive in an initial prototype because long-term ownership is excluded. Platform evaluations can make the opposite mistake by ignoring internal administration and analyst review.
8. Decision activation
This cost is frequently missing from review analysis ROI models. Count the work needed to turn evidence into action:
- preparing the decision packet;
- assigning an owner;
- opening the product, support, quality, or supplier investigation;
- defining a validation method;
- recording what was decided;
- following up on the outcome.
A workflow that generates themes faster but creates more coordination may reduce analysis cost while leaving total decision cost unchanged.
Build the current-state baseline first
Do not compare a detailed vendor proposal with a vague statement that “manual analysis takes a long time.” Measure the existing workflow for at least one comparable cycle.
Use this baseline table:
| Baseline measure | What to record |
|---|---|
| Review scope | Sources, markets, products, competitors, languages, date range |
| Analyst effort | Collection, cleanup, coding, QA, synthesis, reporting hours |
| Stakeholder effort | Review meetings, clarification, rework, handoffs |
| Elapsed time | Request date to decision-ready evidence |
| Rework | Corrections, recoding, repeated exports, duplicate analyses |
| Evidence quality | Source links, scope metadata, counterevidence, validation status |
| Adoption | Decisions receiving the output and decisions that used it |
| Output | Completed decisions, not themes or dashboards produced |
If you cannot measure the baseline perfectly, use a range. A documented low/base/high estimate is more defensible than false precision.
Product review mining: cost and ROI guide quote intake worksheet
Before vendor demos or build estimates, normalize every option into the same intake sheet. This prevents a platform quote, managed-service proposal, and internal build estimate from using different assumptions while appearing comparable.
| Intake field | Why it matters | What to require |
|---|---|---|
| Decision scope | ROI depends on decisions supported, not review volume alone | Named decision, owner, cadence, markets, products, competitors, and evidence standard |
| Included sources | Data coverage changes both value and cost | Source list, permitted access method, refresh frequency, historical window, and exclusions |
| Human effort | Most hidden cost sits in setup, QA, interpretation, and activation | Estimated hours for analysts, engineers, decision owners, procurement, security, and support |
| Variable charges | Usage-based pricing can look small until scope expands | Unit, included allowance, overage rule, seasonality assumption, and forecast owner |
| Quality standard | Cheap output can be expensive if teams cannot trust it | Traceability, sample review, counterevidence, taxonomy versioning, and correction workflow |
| Change cost | Review sources, taxonomies, prompts, markets, and teams change | Cost and lead time for new products, markets, competitors, languages, and fields |
| Exit package | Switching cost belongs in the business case before signing | Exportable evidence, taxonomy, notes, exclusions, decision history, and reconstruction test |
Add one line to the worksheet for each option:
Comparable monthly cost = fixed monthly cost + variable charges + internal labor + QA and governance + activation work + expected change and exit cost
Then divide by the same denominator:
Comparable cost per accepted decision = comparable monthly cost / accepted decisions in the same period
Use accepted decisions rather than generated reports. A report becomes an accepted decision only when the owner confirms that the evidence met the agreed standard and entered the intended workflow.
Red flags in review-mining ROI quotes
Pause the business case when a quote:
- prices by review volume but cannot define the decision denominator;
- omits internal analyst, QA, or activation labor;
- treats implementation as free because a demo is already configured;
- includes revenue lift without an attribution method;
- excludes data-access, translation, or connector maintenance;
- cannot export source evidence and taxonomy history;
- compares a prototype build with a fully operated vendor workflow.
These are not automatic disqualifiers. They are assumptions that must be made explicit before the product review mining ROI calculation can survive finance review. This is where a product review mining: cost and ROI guide should slow the process down: normalize the quote first, then decide whether the economics are worth testing.
Build a pre-purchase ROI audit trail
A product review mining business case should be easy to audit before the first invoice is signed. Keep a short evidence trail that separates the decision, the cost model, the proof standard, and the approval owner. Add the 30-day proof ledger below so the team can see which assumptions are already validated and which still need a pilot.
| Audit item | What to freeze before purchase | Why it matters |
|---|---|---|
| Decision inventory | The recurring decisions the workflow will support, with owner, cadence, and deadline | Prevents a broad "insights platform" purchase from being justified by undefined demand |
| Source boundary | Review sources, markets, products, competitors, languages, history window, and permitted access method | Keeps cost, data coverage, and source-risk assumptions comparable |
| Evidence standard | Review-level traceability, sample QA, contradiction handling, confidence labels, and taxonomy versioning | Stops untraceable summaries from being counted as decision-ready evidence |
| Cost boundary | One-time setup, fixed subscription or retainer, variable usage, internal labor, QA, integration, activation, and exit cost | Makes product review mining cost comparable across build, buy, and service options |
| Benefit boundary | Which benefits are committed, which are sensitivity cases, and which are excluded until attribution improves | Prevents a weak revenue-lift assumption from carrying the whole ROI case |
| Adoption proof | The workflow artifact that shows the decision owner used the output | Separates reports delivered from decisions changed, accelerated, or confirmed |
| Variance owner | One person accountable for scope, rate, effort, volume, adoption, quality, and attribution gaps | Turns post-purchase review into corrective action rather than commentary |
The audit trail does not need to be heavy. A one-page sheet linked to the quote, pilot plan, evidence sample, and decision log is enough for most teams. What matters is that the sheet exists before vendor demos or internal build estimates start shaping the assumptions. In practice, this product review mining: cost and ROI guide becomes the checklist for what that sheet must contain.
Product review mining ROI approval rules
Use these rules when finance or procurement asks whether the product review mining ROI is defensible:
- Use one denominator. Compare cost per accepted decision, not cost per review, dashboard, report, or theme.
- Freeze the current-state baseline. Record current labor, rework, elapsed time, and evidence quality before testing the proposed workflow.
- Separate cost reduction from capacity. Do not count the same released analyst hours as cash savings and increased decision capacity.
- Require traceable evidence. A finding should point back to source reviews, scope metadata, taxonomy, and confidence notes.
- Treat revenue lift as conditional. Keep downstream business outcomes in sensitivity analysis until an agreed measurement design supports attribution.
- Price the exit. Include export, reconstruction, migration, and retraining work before a tool looks cheaper than it really is.
- Review adoption. Lower analysis cost does not create ROI if decision owners do not use the evidence.
These rules are deliberately conservative. They help teams avoid buying a larger review-mining workflow than the business can adopt, and they help a good workflow get credit for measurable operational value before harder downstream attribution is available.
Product review mining ROI formulas
Use the same time period for costs and benefits.
This section is the calculator core of the product review mining: cost and ROI guide. Keep the formulas visible in the approval packet so reviewers can see where every assumption enters the case.
Total cost of ownership
TCO = one-time implementation cost + recurring data cost + recurring software cost + internal labor + QA and governance + integration and administration + decision activation
For a multi-year comparison, apply the discounting method required by your finance team rather than adding future amounts without adjustment.
Net benefit
Net benefit = validated operational savings + attributable business benefit - total cost
Keep operational savings and downstream business outcomes separate. Operational savings are usually easier to observe. Revenue, retention, conversion, and defect-avoidance claims need stronger attribution.
ROI percentage
ROI % = (total benefit - total cost) / total cost × 100
Payback period
Payback months = one-time implementation cost / monthly recurring net benefit
If recurring benefit is zero or negative, the workflow does not pay back under the current assumptions.
Cost per completed decision
Cost per completed decision = total workflow cost / decisions delivered to the agreed standard
Time to decision
Time-to-decision improvement = baseline elapsed time - proposed elapsed time
Time saved is not automatically cash saved. It becomes a financial benefit only when the organization can explain what the released capacity replaces, avoids, or enables.
Use confidence-weighted benefits instead of optimistic totals
Many business cases fail because every possible benefit is treated as certain. Assign a confidence factor to each benefit based on evidence quality.
Confidence-weighted benefit = estimated benefit × confidence factor
Example confidence rules:
| Confidence | Evidence standard | Treatment |
|---|---|---|
| 100% | Directly observed and finance-approved | Include in committed case |
| 75% | Repeated pilot evidence with a stable baseline | Include in base case with assumption note |
| 50% | Plausible, partially measured | Include only in sensitivity analysis |
| 25% | Directional hypothesis | Keep in upside case |
| 0% | Unmeasured claim | Exclude from ROI |
This does not make a weak estimate accurate. It makes uncertainty visible and prevents the largest hypothetical benefit from dominating the decision.
A worked labor-only example
Assume a team runs one recurring review-analysis cycle each month.
Current workflow
- 18 analyst hours per cycle;
- 5 stakeholder and rework hours;
- burdened labor rate of $70 per hour;
- 12 cycles per year.
Annual labor cost:
(18 + 5) × $70 × 12 = $19,320
Proposed workflow
- 7 analyst hours per cycle;
- 3 stakeholder and rework hours;
- same burdened labor rate;
- $8,400 annual software, data, and administration cost;
- $3,500 one-time implementation cost.
Annual recurring cost:
(7 + 3) × $70 × 12 + $8,400 = $16,800
First-year cost:
$16,800 + $3,500 = $20,300
The proposed workflow costs $980 more in year one in this illustrative labor-only case. It saves $2,520 per year after the one-time implementation cost is removed.
That does not prove the investment is poor. It shows what still needs validation: faster decisions, reduced defects or rework, increased decision capacity, or a larger recurring scope. It also prevents a team from claiming immediate savings that the arithmetic does not support.
These numbers are illustrative, not a market benchmark or VOC.AI price quote.
Build a three-scenario approval table
A single ROI number hides the assumptions most likely to change. Present low, base, and high cases using the same cost scope and period. Change only the uncertain benefit assumptions, and show which evidence would move an estimate from one case to another.
Use these columns:
| Scenario field | Low case | Base case | High case |
|---|---|---|---|
| First-year TCO | $20,300 | $20,300 | $20,300 |
| Confidence-weighted annual benefit | $10,000 | $24,000 | $36,000 |
| First-year net benefit | -$10,300 | $3,700 | $15,700 |
| First-year ROI | -50.7% | 18.2% | 77.3% |
| Monthly recurring net benefit after implementation | Negative | $600 | $1,600 |
| Payback on $3,500 implementation cost | No payback | 5.8 months | 2.2 months |
The table extends the worked example above. The benefit amounts are illustrative, not market benchmarks or a VOC.AI quote. Recalculate them from your own time logs, avoided spend, capacity records, and attributable outcomes.
Keep the cost side stable across scenarios unless the implementation scope truly changes. Otherwise a high case can quietly assume both lower cost and higher benefit, making the comparison difficult to audit.
For each benefit, add a trigger that changes its confidence. For example:
- analyst time moves from 50% to 100% confidence after two matched cycles reproduce the reduction;
- decision-capacity value moves into the base case only after owners complete additional decisions, not merely after analysts report available time;
- reduced returns remain an upside case until a measured intervention separates the product change from price, promotion, seasonality, and inventory effects.
Use approval gates, not one impressive ROI percentage
A finance-ready proposal should pass several gates at once. Define the thresholds with finance, procurement, security, and the decision owner before the pilot result is known.
| Gate | Approval question | Evidence to attach | Stop or refine when |
|---|---|---|---|
| Problem gate | Is there a recurring decision worth improving? | Decision log, request volume, current delay | The use case is rare, ownerless, or undefined |
| Cost gate | Is current and proposed TCO measured on the same scope? | Time logs, vendor quote, data and integration estimates | Material cost buckets are excluded |
| Evidence gate | Are themes reproducible and traceable? | Review-level sample, taxonomy, QA record, contradictions | Decision owners cannot inspect supporting evidence |
| Adoption gate | Did the output enter a real workflow? | Ticket, roadmap item, research record, owner sign-off | The pilot produces reports but no decisions |
| Finance gate | Does the base case clear the organization’s hurdle? | Scenario table, benefit ledger, payback calculation | The case works only under unverified upside assumptions |
| Risk gate | Are access, privacy, claims, and change controls acceptable? | Security review, source policy, governance owner | A critical control has no owner or mitigation |
This structure prevents a positive ROI calculation from overruling a failed evidence, adoption, or risk test. It also gives the team a useful outcome when the answer is "not yet": the failed gate tells you what the next experiment must resolve.
Copy this one-page review-mining business case
Use the following memo as the approval page. Put detailed calculations, samples, and contracts in appendices.
| Field | What to write |
|---|---|
| Decision | The recurring product, market, quality, pricing, or support decision the workflow will support |
| Owner and deadline | One accountable decision owner and the date evidence is needed |
| Current workflow | Sources, scope, frequency, labor, rework, elapsed time, evidence standard |
| Proposed workflow | Manual, assisted, platform/API, or custom operating model |
| First-year TCO | All eight cost buckets, with one-time and recurring cost separated |
| Base-case benefit | Confidence-weighted operational benefit plus separately identified attributable outcomes |
| Unit economics | Cost per completed decision before and after |
| Payback | Implementation cost divided by recurring monthly net benefit |
| Proof result | Matched pilot results, quality sample, contradictions, adoption evidence |
| Risks | Data access, privacy, evidence quality, integration, vendor dependency, public-claim risk |
| Recommendation | Stop, refine, limited rollout, or scale, with the next review date |
The recommendation should state what is deliberately excluded. A credible memo may say that revenue lift, retention, or return reduction is not yet included because attribution has not been established. Excluding a weak benefit can make the case more persuasive, not less. A product review mining: cost and ROI guide is strongest when it tells finance which benefits are not yet ready to count.
Add a finance review packet
For procurement or annual planning, attach a compact finance review packet to the memo:
| Packet artifact | Minimum contents | Reviewer question it answers |
|---|---|---|
| Baseline snapshot | Current labor, elapsed time, rework, scope, output quality, and decision adoption | What does the current process really cost? |
| Quote normalization sheet | Fixed cost, variable cost, included volume, overage, internal labor, QA, activation, and exit assumptions | Are all options priced against the same job? |
| Evidence sample | Source-linked reviews, taxonomy, contradictions, confidence notes, and accepted decision packet | Can the business inspect the evidence behind the finding? |
| Scenario table | Low, base, and high cases with the same cost boundary | Which assumptions drive payback and ROI? |
| Benefit ledger | Benefit owner, measurement method, confidence, included case, and double-counting check | Which benefits are recognized, delayed, or excluded? |
| Adoption record | Decision owner sign-off, ticket, roadmap item, research record, or supplier investigation | Did the output enter a real workflow? |
| Risk and exit note | Data access, privacy, public-claim risk, vendor dependency, export, and reconstruction result | What would make the case fail after purchase? |
Do not wait for a perfect model. The packet should make uncertainty visible. If the baseline is a range, show the range. If the downstream outcome is unmeasured, leave it out of the committed ROI and list the test required to recognize it later.
Add a 30-day proof ledger
Use a compact proof ledger to show whether the workflow is actually cheaper, faster, and easier to adopt than the current process. It should travel with the quote and the pilot plan.
| Proof item | Day 0 baseline | Day 30 check | What counts as proof |
|---|---|---|---|
| Cost per completed decision | Current workflow cost divided by accepted decisions | Same denominator after the pilot | Lower or stable cost with the same evidence standard |
| Adoption leakage | Decisions delivered vs. decisions used | Same ratio after the pilot | Leakage is flat or improving |
| Exitability | Can we reconstruct the packet outside the tool? | Run a portability drill | Evidence, taxonomy, and notes export cleanly |
| Scope drift | Approved source list and cadence | Compare actual vs. approved scope | No hidden expansion in markets, sources, or volume |
| Change cost | Expected setup and maintenance burden | Track real change requests | Change cost stays within the approved range |
If the ledger does not improve by day 30, the next decision should be to refine scope or stop, not to expand.
Run the product review mining ROI approval meeting
A business case can be mathematically complete and still fail because no one owns the decision. Before approving software, a managed-service statement of work, or an internal build sprint, run one approval meeting with a fixed packet, fixed roles, and fixed exit choices.
The meeting should not debate whether product review mining is interesting. It should decide whether the current business case is strong enough to fund the next commitment.
Use this agenda:
| Agenda item | Owner | Evidence on screen | Decision to make |
|---|---|---|---|
| Confirm the decision inventory | Product or research lead | Named decisions, cadence, owner, deadline, and evidence standard | Which decisions are in scope for the business case? |
| Lock the cost boundary | Finance | Setup, fixed, variable, labor, QA, integration, activation, change, and exit cost | Which costs are committed, ranged, or excluded? |
| Inspect the evidence sample | Analyst or workflow owner | Source-linked reviews, taxonomy, contradiction log, and confidence notes | Does the evidence meet the acceptance standard? |
| Review adoption proof | Decision owner | Ticket, roadmap item, supplier investigation, research record, or sign-off | Did the output enter a real workflow? |
| Test the benefit ledger | Finance and analytics | Benefit owner, method, confidence, included case, and double-counting check | Which benefits can enter the base case now? |
| Choose the next commitment | Executive sponsor | Low, base, high scenario table and unresolved risks | Stop, refine, pilot, resize, buy, build, or renew |
The strongest output is a one-line decision:
We approve [next commitment] for [scope] because [accepted decisions] met [evidence standard] at [cost per used decision], with [excluded benefits] left out until [measurement condition] is met.
If the group cannot fill that sentence, the business case is not ready. Do not solve that by adding a larger upside number. Fix the missing owner, scope, evidence, adoption record, or measurement method.
Approval meeting decision rules
Use consistent rules so the product review mining ROI case does not change shape depending on who is in the room.
| Result | Use when | Next action |
|---|---|---|
| Stop | The decision is rare, ownerless, unsupported by permitted data, or cheaper to handle manually at the same evidence standard | Close the case and record the reason |
| Refine | The decision is real, but the evidence standard, data scope, cost boundary, or benefit method is incomplete | Fix one blocker and rerun the packet |
| Pilot | The case has a named owner, credible baseline, accepted evidence standard, and a measurable 30- or 90-day proof plan | Fund the smallest matched-scope test |
| Resize | The business case works only at a narrower scope, fewer sources, lower capacity, or different operating model | Reprice the smaller commitment before signing |
| Buy or build | Base-case economics clear the hurdle and adoption proof shows recurring use | Approve with variance owners and the first review date |
| Renew or expand | Realized cost, adoption, evidence quality, and risk remain inside the agreed bands | Extend only the scope with observed demand |
These rules protect both sides of the decision. Finance gets a clean explanation of what is being funded. Product and research teams get a path to keep useful review intelligence alive when the first business case is directionally right but still too broad.
Add a pre-read checklist
Send the pre-read at least one business day before the approval meeting. Keep it short enough that every reviewer can inspect it.
| Pre-read item | Maximum length | Must include |
|---|---|---|
| Decision inventory | 1 page | Decisions, owners, cadence, deadlines, and evidence standard |
| Baseline snapshot | 1 page | Current labor, elapsed time, rework, cost, evidence quality, and adoption |
| Cost model | 1 page | One-time, recurring, variable, internal, QA, activation, change, and exit cost |
| Evidence sample | 3-5 findings | Source links, scope metadata, taxonomy, contradictions, and confidence |
| Scenario table | 1 page | Low, base, high cases with the same cost boundary |
| Benefit ledger | 1 page | Benefit owner, method, confidence, included case, and double-counting note |
| Recommendation | 5 lines | Stop, refine, pilot, resize, buy/build, renew, or expand |
Do not attach every exported review or every model output. The purpose of the pre-read is to make the decision inspectable, not to overwhelm reviewers with raw material.
Separate four benefit layers
Do not place every possible outcome in one ROI numerator.
Layer 1: direct operational savings
Examples:
- fewer analyst hours;
- fewer repeated exports and cleanup steps;
- less recoding and report rework;
- lower external research spend;
- lower maintenance cost than the current system.
These are usually the strongest initial benefits because the baseline can be observed.
Layer 2: capacity and cycle-time value
Examples:
- more products or competitors analyzed with the same team;
- faster escalation of recurring defects;
- shorter time from review signal to investigation;
- less waiting for a quarterly research project;
- reuse of the same evidence across product, support, and marketing.
Track capacity separately from cash savings unless the organization can show how released time changes cost or output.
Layer 3: decision-quality value
Examples:
- better source traceability;
- clearer contradictory evidence;
- fewer decisions based on the loudest anecdote;
- more consistent taxonomy across teams;
- explicit separation of product, delivery, support, and seller problems.
Use a scorecard or before-and-after review. Avoid forcing an arbitrary dollar value onto every quality improvement.
Layer 4: attributable business outcomes
Examples may include reduced returns, lower support contacts, improved conversion, stronger retention, fewer defects, or higher revenue. Include these only when:
- review mining identified a specific problem;
- an intervention was implemented;
- an appropriate measurement design compared the outcome;
- major confounders were considered;
- the attribution rule was agreed before the result was known.
Review mining can identify what to test. It does not, by itself, prove that the subsequent change caused the business result.
Avoid double-counting benefits
The same improvement can appear under several labels. For example, “analyst hours saved,” “increased research capacity,” and “faster time to insight” may all come from the same removed work.
Use one primary treatment:
- count released labor as cash savings only if cost is actually removed or avoided;
- count it as capacity if the team completes more decisions;
- count it as cycle-time value if the same decision finishes earlier;
- do not count all three at full value.
Create a benefit ledger with these columns:
| Benefit | Baseline | Measurement method | Owner | Confidence | Included case | Double-counting check |
|---|---|---|---|---|---|---|
| Analyst hours reduced | Time log | Same-scope comparison | Research ops | 100% | Base | Not also counted as cash and capacity |
| Faster defect escalation | Ticket timestamps | Before/after median | Quality lead | 75% | Base | Separate from analyst hours |
| Reduced returns | Return-rate comparison | Controlled or matched analysis | Product lead | 50% | Sensitivity | Excludes unrelated operational changes |
Manual, assisted, platform, or custom: how to choose
| Criterion | Manual | General AI or scripts | Dedicated platform/API | Custom build |
|---|---|---|---|---|
| One-time narrow question | Strong | Strong | Moderate | Weak |
| Recurring monitoring | Weak | Moderate | Strong | Strong |
| Source traceability | Variable | Must be designed | Evaluate explicitly | Must be built |
| Taxonomy consistency | Weak to moderate | Moderate | Strong if governed | Strong if maintained |
| Integration potential | Low | Moderate | Strong if supported | Strong |
| Internal technical burden | Low | Moderate | Low to moderate | High |
| Governance burden | Informal but real | High if unmanaged | Shared with vendor | Fully internal |
| Flexibility | High but labor-intensive | High | Product-dependent | Highest |
Choose based on the recurring operating requirement:
- Stay manual when the question is rare, narrow, and unlikely to recur.
- Use scripts or general AI when the team can maintain the workflow and verify outputs.
- Evaluate a dedicated platform when analysis repeats across products, competitors, markets, or teams.
- Build internally when the scale, proprietary logic, and integration value justify sustained engineering ownership.
For technical evaluation, compare data access, traceability, integration, and governance—not just summary quality. VOC.AI provides a Review Analysis API and a Voice of Customer Analysis workflow for teams evaluating repeatable review intelligence.
Compare build, buy, and managed service over 12 months
A fair operating-model decision compares the same scope, evidence standard, service level, and decision volume. A common procurement mistake is to compare a vendor's full production price with an internal prototype that excludes maintenance, support, governance, and source changes.
Create a 12-month cost model for each viable option:
12-month operating-model cost = one-time enablement + fixed run cost + variable usage + internal labor + assurance cost + expected change cost + expected exit cost
Use expected cost for uncertain events:
Expected event cost = probability of event × financial impact if it occurs
Do not use arbitrary probabilities. Start with a range, record the evidence behind it, and update the assumption after the pilot.
| Cost component | Build internally | Buy platform or API | Managed service |
|---|---|---|---|
| One-time enablement | Architecture, data pipeline, taxonomy, evaluation, security, deployment | Procurement, configuration, source setup, integration, training | Briefing, access setup, taxonomy alignment, operating cadence |
| Fixed run cost | Engineering ownership, infrastructure, observability, support | Subscription or committed platform fee, administration | Retainer or committed project capacity |
| Variable cost | Data, model calls, storage, incremental compute | Usage tiers, overages, data or enrichment charges | Per-project, per-market, per-SKU, or change-request fees |
| Assurance cost | Benchmark maintenance, QA review, incident handling, governance | Internal acceptance testing plus vendor review | Internal validation of provider methods and deliverables |
| Change cost | Source breakages, model changes, new markets, taxonomy revisions | Plan upgrades, integration changes, vendor roadmap gaps | Scope changes, new briefs, turnaround constraints |
| Exit cost | Documentation, export, migration, replacement build, knowledge transfer | Data export, contract transition, integration replacement | Artifact handoff, method transfer, rebuilding internal capability |
Use cost per accepted decision as the common denominator
Annual totals alone can hide low utilization. Normalize each option by the output the business actually accepts:
Cost per accepted decision = 12-month operating-model cost / decisions accepted by the named owner
Also calculate:
Utilization-adjusted unit cost = committed 12-month cost / decisions actually completed
If a platform was sized for 120 decisions but only 45 were completed, use 45 in the realized calculation. If a custom team spends most of its time maintaining connectors, do not treat that maintenance as free capacity.
Find the crossover point instead of declaring one model cheaper
The crossover point is the decision volume at which two operating models have the same expected cost.
For options A and B:
Crossover volume = (fixed cost A − fixed cost B) / (variable cost B − variable cost A)
Only use this formula when the variable costs differ and both options produce comparable evidence. Then test the result against capacity, latency, quality, and risk constraints. The mathematically cheaper option may still fail if it cannot meet the required turnaround time or source-traceability standard.
Build a range rather than one false-precision answer:
| Assumption | Low case | Base case | High case | Evidence that changes it |
|---|---|---|---|---|
| Decisions required per month | 4 | 10 | 20 | Roadmap and research calendar |
| Reviews per decision | Defined scope | Defined scope | Defined scope | Pilot sample and source coverage |
| Internal QA hours per decision | Pilot low | Pilot median | Pilot high | Time log and correction log |
| Source-change events per year | Low estimate | Expected estimate | Stress estimate | Connector history and vendor evidence |
| Exit or migration effort | Clean export | Partial rebuild | Full rebuild | Portability drill |
Add an exitability test before signing
Low first-year cost can be misleading when evidence, taxonomy, or workflow history cannot move with you. Before approval, run a portability drill:
- Export the review-level source data used in one completed decision.
- Export theme definitions, taxonomy versions, evidence links, exclusions, and analyst notes.
- Reconstruct the decision packet outside the proposed system.
- Measure elapsed time, missing fields, manual cleanup, and undocumented dependencies.
- Price the work required to migrate one quarter of normal volume.
Add that result to the expected exit cost. If the drill cannot be completed, treat exit cost as unresolved risk rather than zero.
Use five operating-model gates
| Gate | Evidence required | Stop or refine when |
|---|---|---|
| Scope equivalence | Same sources, languages, decision type, evidence standard, and cadence | One option is priced against a smaller job |
| Production completeness | Maintenance, support, monitoring, QA, security, and change work included | A prototype is compared with a production service |
| Utilization | Named owners and realistic monthly decision volume | Committed capacity has no adoption path |
| Portability | Tested export and reconstruction path | Evidence or taxonomy cannot be transferred |
| Crossover resilience | Low/base/high volume and change-cost scenarios | The preferred model wins only under one fragile assumption |
The result is not necessarily “build” or “buy.” A staged model can be more rational: use a managed service to define the taxonomy, a platform or API for recurring processing, and internal analysts for acceptance, interpretation, and decision activation. Price the handoffs and duplicated work rather than assuming a hybrid model is automatically cheaper.
The 30-day proof plan
Week 1: define and baseline
- Choose one recurring decision.
- Freeze the review scope and evidence standard.
- Measure current labor, elapsed time, rework, and output quality.
- Record the current cost per completed decision.
Week 2: run a matched workflow
- Analyze the same scope with the proposed method.
- Require review-level evidence links and scope metadata.
- Record setup, analysis, QA, and stakeholder hours separately.
- Log contradictions and corrections instead of hiding them.
Week 3: test decision usefulness
- Give the evidence packet to the actual decision owner.
- Ask whether it changed, accelerated, narrowed, or confirmed the decision.
- Record the action taken and validation plan.
- Compare decision quality with the baseline workflow.
Week 4: calculate and decide
- Calculate operational savings first.
- Add confidence-weighted benefits.
- Run low, base, and high scenarios.
- Review double counting and excluded costs.
- Decide to stop, refine, or scale.
For applied examples, see review mining for product development, review mining for pricing, and review mining for market research.
Turn the pilot into a 90-day cost ledger
A 30-day pilot can prove that a workflow works. It rarely shows the full operating cost. Procurement and finance need a view that separates one-time setup, recurring fixed cost, variable usage, and internal adoption work over a period long enough to expose maintenance and rework.
Use a 90-day ledger with four sections:
| Ledger section | Include | Keep separate because |
|---|---|---|
| One-time enablement | Security review, procurement, source setup, taxonomy design, integration, training | These costs should not be mistaken for monthly run rate |
| Recurring fixed cost | Subscription, committed platform fee, administration, scheduled QA, governance review | These costs continue even when utilization is low |
| Variable cost | Data acquisition, usage charges, model calls, translation, storage, incremental analyst review | These costs change with scope and volume |
| Activation and adoption | Decision-owner meetings, workflow changes, evidence packaging, follow-up, outcome review | Analysis has no economic value until someone uses it |
Build the ledger by week rather than entering one quarter-level estimate. Weekly entries reveal whether setup cost is falling, whether QA expands with scale, and whether decision activation is becoming repeatable.
| Week | Reviews in scope | Decisions requested | Decisions completed | Setup hours | Analysis hours | QA hours | Activation hours | External cost | Rework hours |
|---|---|---|---|---|---|---|---|---|---|
| 1 | |||||||||
| 2 | |||||||||
| 3 | |||||||||
| … | |||||||||
| 13 |
At the end of 90 days, calculate three views:
- Pilot-inclusive cost per decision includes all setup and operating cost. Use it to judge the initial investment.
- Steady-state cost per decision excludes nonrecurring setup but includes ongoing administration, QA, activation, and expected maintenance. Use it for annual planning.
- Marginal cost per additional decision includes only the cost created by one more decision at the same evidence standard. Use it to evaluate expansion.
Do not divide cost by every dashboard view, summary, theme, or export. The denominator must be a completed decision delivered to the agreed evidence standard.
Reconcile forecast ROI with realized value at 30, 90, and 180 days
An approval model is a forecast. A renewal decision needs actuals. Keep the original assumptions frozen, then reconcile them against observed cost, adoption, and benefit instead of silently replacing the forecast with a more favorable story.
The US GAO Cost Estimating and Assessment Guide treats a credible estimate as something that is updated with actual costs and explained variances. The same discipline makes a review-mining business case auditable: preserve the baseline, record what changed, assign an owner to each variance, and show whether the change is temporary or structural.
Build a forecast-to-actual bridge with five value movements:
| Bridge movement | Question | Evidence | Treatment |
|---|---|---|---|
| Baseline correction | Was the original current-state cost wrong? | Time logs, invoices, rework records, corrected scope | Restate the baseline and preserve the original assumption for auditability |
| Cost variance | Did implementation or operating cost differ from plan? | Contract, usage, labor, QA, integration, support records | Add favorable or unfavorable variance to realized cost |
| Volume variance | Did the team analyze the expected number of products, sources, or decision requests? | Intake and scope log | Explain separately from unit-cost performance |
| Adoption variance | Did decision owners use the completed evidence packets? | Decision log, tickets, roadmap or research records | Reduce realized capacity value when outputs were not used |
| Benefit variance | Did measured savings or attributable outcomes differ from the approved case? | Matched workflow results, finance records, experiment output | Recognize only the amount supported at the approved confidence level |
Use a simple bridge rather than one revised ROI percentage:
Realized net benefit = approved benefit + benefit variance - cost variance - adoption leakage
Realized ROI = (realized net benefit - actual total cost) / actual total cost × 100
Do not use the bridge to create precision that the evidence does not support. If an effect cannot be separated from seasonality, price changes, promotions, inventory, staffing, or another initiative, keep it in an unverified column rather than moving it into realized benefit.
Use one variance code for every gap
Variance discussions become vague when every miss is labeled “adoption.” Assign one primary code and one accountable owner.
| Variance code | Typical cause | Owner | Corrective question |
|---|---|---|---|
| SCOPE | More products, markets, languages, sources, or use cases than approved | Program owner | Should the business case be resized or the scope reduced? |
| RATE | Subscription, data, model, contractor, or burdened labor rate differs | Finance or procurement | Is the rate temporary, negotiable, or structural? |
| EFFORT | Analysis, QA, integration, or activation requires more hours | Workflow owner | Which step creates rework, and can it be removed without lowering evidence quality? |
| VOLUME | Fewer or more qualified decision requests than forecast | Decision owner | Is demand weak, seasonal, or blocked by intake design? |
| ADOPTION | Completed evidence is not used in a decision | Functional leader | Was the question wrong, the delivery late, or the evidence untrusted? |
| QUALITY | Corrections, contradictions, or traceability failures reduce usable output | QA or governance owner | Which control must improve before expansion? |
| ATTRIBUTION | A downstream outcome cannot be isolated from other changes | Analytics or finance | What experiment or comparison would support recognition? |
A variance without an owner is only an explanation. A useful reconciliation connects the gap to a decision: change the workflow, change the scope, change the commercial terms, improve measurement, or stop counting the benefit.
Run three different reconciliation reviews
Day 30: operating truth. Check setup cost, source access, time per cycle, QA burden, traceability, and whether at least one real decision used the output. Do not annualize a pilot result if the workflow still depends on exceptional support or manual cleanup.
Day 90: steady-state truth. Separate one-time enablement from recurring cost, calculate utilization and adoption-adjusted cost per decision, and close the largest scope, rate, effort, and adoption variances. Decide whether the workflow is ready to expand, needs a narrower use case, or should stop.
Day 180: realized-value truth. Test whether operational savings persisted, whether decision owners still use the workflow, and whether any downstream benefit has earned a higher confidence level. Use this review for renewal, contract resizing, integration investment, or migration planning.
Copy this reconciliation table into the business case:
| Line item | Approved forecast | Actual | Variance | Code | Confidence | Owner | Decision |
|---|---|---|---|---|---|---|---|
| One-time enablement cost | High | ||||||
| Recurring operating cost | High | ||||||
| Completed decisions | High | ||||||
| Adopted decisions | High | ||||||
| Direct labor and rework savings | |||||||
| Capacity or cycle-time value | |||||||
| Attributable downstream outcomes | |||||||
| Realized net benefit |
Keep the forecast, actual, and unverified opportunity columns separate. That prevents an optimistic pipeline of possible benefits from being reported as realized ROI and gives finance a clean explanation of why the case improved or weakened.
Adjust ROI for adoption and utilization
A platform can look efficient in a controlled pilot and still underperform after purchase because the licensed capacity is not used or because decision owners do not act on the output.
Track two rates separately:
Workflow utilization = completed analysis cycles / funded analysis capacity
Decision adoption = decisions that used the evidence / completed analysis cycles
Then calculate an adoption-adjusted unit cost:
Adoption-adjusted cost per decision = total operating cost / decisions that used the evidence
Illustrative example:
- The funded workflow can support 20 decision packets per quarter.
- The team completes 12 packets.
- Decision owners use 8 packets.
- Quarterly operating cost is $24,000.
The nominal cost per completed packet is $2,000. The adoption-adjusted cost per used decision is $3,000. Neither figure is a market benchmark; both come from the same internal cost ledger and show different operating problems.
- Low utilization with high adoption suggests weak intake, excess capacity, or a scope that is too narrow.
- High utilization with low adoption suggests poor question selection, weak evidence, slow delivery, or missing workflow integration.
- Low utilization and low adoption suggests that the team has not established a repeatable operating need.
- High utilization and high adoption is necessary for scale, but it still does not prove downstream financial impact.
Set expansion, renewal, and stop thresholds before buying
Do not wait until renewal month to decide whether review mining is valuable. Agree on thresholds during procurement, then review them at days 30, 60, and 90.
| Decision | Minimum evidence | Example threshold type | Action if missed |
|---|---|---|---|
| Continue pilot | Same-scope workflow is operational | Evidence traceability and QA acceptance | Fix the workflow before adding users or sources |
| Expand to another team | First team repeatedly uses outputs | Decision adoption and repeat use | Keep scope fixed until adoption is repeatable |
| Add more data sources | Current source produces useful, governed evidence | Incremental decision value exceeds incremental cost | Do not buy coverage that has no named decision owner |
| Sign or renew annual contract | Steady-state economics meet the organization’s hurdle | Cost per used decision, payback, and risk acceptance | Renegotiate, reduce scope, switch approach, or stop |
| Approve custom integration | Manual handoff is a proven bottleneck | Avoided rework or cycle-time value exceeds build and maintenance cost | Keep the integration manual until demand is demonstrated |
Use explicit red, yellow, and green bands for each metric. Set the bands from your baseline and finance requirements, not from a generic software ROI claim.
Expand when
- at least one recurring decision has a named owner and cadence;
- outputs meet the agreed traceability and QA standard;
- decision adoption is stable across several cycles, not one executive demo;
- steady-state cost per used decision is better than the realistic alternative;
- additional scope has a named owner, measurable demand, and a separate benefit hypothesis.
Refine when
- analysts save time but decision owners do not use the evidence;
- the workflow produces useful themes but too much manual correction;
- cost falls while cycle time, traceability, or evidence quality deteriorates;
- usage is concentrated in one champion with no operating owner;
- the expected benefit exists, but the measurement method is still weak.
Stop or reduce scope when
- the same decision can be supported more cheaply at the same evidence standard;
- permitted data access or source quality cannot support the intended use;
- recurring administration and QA erase the expected operating savings;
- no team owns activation, follow-up, and outcome review;
- the business case still depends mainly on unvalidated revenue attribution after 90 days.
Prepare a renewal evidence packet
The renewal packet should let a finance or procurement reviewer reproduce the decision without relying on a vendor presentation.
Include:
- the approved baseline and all changes to scope;
- the 90-day cost ledger with one-time and recurring costs separated;
- completed decisions, adopted decisions, and the evidence standard used;
- utilization, adoption-adjusted cost per decision, time to decision, and rework;
- a sample of source-linked evidence packets, including contradictions and corrections;
- the benefit ledger with confidence and double-counting checks;
- incidents, access limitations, model or taxonomy changes, and unresolved risks;
- the low, base, and high renewal scenarios;
- the decision: expand, renew as-is, reduce scope, switch, or stop;
- the next measurement date and accountable owner.
This packet turns renewal into an operating decision. It also makes vendor comparisons fairer because each option is evaluated against the same decision scope, cost boundary, and evidence standard.
Review-mining ROI scorecard
Use the same scorecard before and after the pilot.
The scorecard is the inspection layer of the product review mining: cost and ROI guide. It makes the case easier to revisit when adoption, utilization, or downstream attribution changes.
| Metric | Baseline | Pilot | Target | Evidence source |
|---|---|---|---|---|
| Cost per completed decision | Time and expense records | |||
| Analyst hours per cycle | Time log | |||
| Stakeholder and rework hours | Calendar and project log | |||
| Request-to-decision days | Request and decision timestamps | |||
| Reviews with source traceability | Audit sample | |||
| Themes passing validation | QA record | |||
| Decisions using the output | Decision log | |||
| Findings reused by another team | Repository or workflow record | |||
| Attributable downstream outcome | Experiment or matched comparison |
Common ROI mistakes
Counting output instead of value
Reviews processed, themes generated, dashboards opened, and summaries written are activity metrics. Measure completed decisions, interventions, cycle time, rework, and validated outcomes.
Treating review frequency as customer prevalence
Reviewers self-select. A theme appearing in 15% of collected reviews does not automatically mean 15% of all customers experience it. Report the source, date range, product scope, rating mix, market, and inclusion rules.
Using revenue lift as the default business case
Revenue is influenced by price, promotion, inventory, channel mix, competition, seasonality, and many other factors. Start with observable operational return and add revenue only when attribution is credible.
Ignoring the cost of bad analysis
A fast but untraceable summary can create false confidence, wasted roadmap work, or unsupported marketing claims. Count QA, correction, and governance as part of the workflow.
Comparing unequal scopes
Do not compare manual analysis of 500 reviews with an automated system covering ten markets and 20 competitors, then label the difference “efficiency.” Hold the decision, scope, and evidence standard constant.
Turning review text into ungoverned claims
The US Federal Trade Commission’s Consumer Reviews and Testimonials Rule guidance addresses fake or false reviews, sentiment-conditioned incentives, and review suppression. Review analysis, testimonials, and advertising substantiation are separate workflows. Preserve context and review applicable requirements before using customer language as a public claim.
Questions to ask a review-mining vendor
- Which data-access methods are supported and permitted?
- Can every theme and summary be traced to source reviews?
- How are duplicates, spam, variants, languages, and missing metadata handled?
- Can we define and version our own taxonomy?
- How are confidence, disagreement, and counterevidence shown?
- What analyst QA is still required?
- Which costs increase with sources, markets, users, volume, or model usage?
- What implementation, integration, security, and administration work remains internal?
- Can outputs enter our roadmap, support, research, or quality workflow?
- Can we export the data, taxonomy, evidence, and decision history?
- How are model, prompt, and product changes communicated?
- What will a matched 30-day pilot prove before a larger commitment?
Frequently asked questions
How much should a company budget for product review mining?
Budget from the required decision backward. Include data access, preparation, analyst labor, software, QA, integration, governance, operations, and decision activation. A one-time manual investigation may need little software spend. A recurring cross-product workflow may justify more fixed tooling to reduce repeated labor and rework.
Is product review mining software cheaper than manual analysis?
Not automatically. It is cheaper when the reduction in recurring labor, rework, maintenance, and delay exceeds software, data, implementation, and governance cost for the same scope and evidence standard.
What is a good ROI for review mining?
There is no universal benchmark. Use your organization’s investment threshold and finance method. A modest calculation based on observed costs is more useful than a large percentage built on assumed revenue lift.
How quickly should review-mining software pay back?
Calculate payback from one-time implementation cost and recurring monthly net benefit. The acceptable period depends on contract length, switching cost, risk, and your organization’s capital-allocation rules.
Can review mining prove that a product change increased revenue?
No. Review mining can identify a problem and inform an intervention. Revenue attribution requires a suitable experiment or comparison that isolates the effect of the change.
What should a pilot prove before scaling?
A pilot should show whether the workflow lowers cost per completed decision, improves cycle time or evidence quality, and produces outputs that decision owners use. It should also reveal data-access, integration, governance, and adoption costs before a larger commitment.
What should a team measure before renewing review-mining software?
Measure steady-state operating cost, completed and adopted decisions, utilization, adoption-adjusted cost per decision, evidence quality, rework, cycle time, unresolved risks, and any downstream benefit that can be attributed without double counting. Compare those results with the realistic manual, assisted, platform, or custom alternative.
How often should a team reconcile forecast and realized review-mining ROI?
Use day 30 to verify operating assumptions, day 90 to establish steady-state cost and adoption, and day 180 to test persistence and renewal value. Reconcile earlier after a material scope, contract, data-access, staffing, or workflow change.
Should we build an internal review-mining system?
Build when proprietary logic, scale, integration, or control justifies sustained engineering and governance ownership. Do not compare a prototype’s short-term build cost with a platform’s full production cost; include maintenance, observability, source changes, security, and user support.
How do we compare a review-mining platform with a managed service?
Compare the same decision scope over 12 months. Include fixed fees, variable charges, internal coordination, quality assurance, change requests, turnaround constraints, portability, and expected exit cost. Then divide by accepted decisions, not reviews processed or reports delivered.
What should a review-mining portability drill prove?
It should prove that your team can export review-level evidence, taxonomy definitions, analysis notes, exclusions, and decision history, then reconstruct a usable decision packet outside the system. Measure missing fields and migration labor and include them in the operating-model business case.
What should a product review mining cost and ROI guide collect before vendor demos?
Collect the decision scope, source list, refresh cadence, current labor hours, evidence standard, QA requirements, integration needs, expected change requests, and exit requirements before demos. Ask each vendor or internal build team to price the same scope, then compare cost per accepted decision rather than subscription price or review volume. That is the practical reason to use a product review mining: cost and ROI guide before product tours start.
What should finance review before approving product review mining software?
Finance should review the current-state baseline, total cost boundary, quote normalization sheet, confidence-weighted benefit ledger, adoption proof, scenario table, and exitability result. The committed case should rely on observed operational savings and accepted decisions. Revenue, retention, return reduction, or conversion lift should stay in a sensitivity case until the measurement method can isolate the effect of the review-mining workflow from other changes.
Who should attend the product review mining ROI approval meeting?
Invite finance, the decision owner, the workflow owner, procurement when a contract is involved, security or legal when data access requires review, and the executive sponsor who can approve the next commitment. Do not let the meeting become a general demo. The group should inspect the packet and choose stop, refine, pilot, resize, buy/build, renew, or expand.
What should be decided before signing a review-mining contract?
Decide the scoped decisions, evidence standard, cost boundary, accepted benefit method, variance owners, first review date, and exit package. If those fields are not settled, the product review mining business case is still an assumption set rather than an approval-ready plan.
The bottom line
A defensible review-mining business case is not “AI will increase revenue.” It is a chain of observable facts:
- the team spends a measured amount producing review evidence today;
- the proposed workflow changes identifiable labor, rework, delay, or capacity;
- evidence becomes traceable and reusable;
- findings enter a defined decision and validation process;
- benefits are confidence-weighted and checked for double counting;
- forecast-to-actual variances are explained, owned, and tied to a corrective decision;
- build, buy, and managed-service options are compared over the same 12-month production scope;
- quote scope is normalized before vendors, managed services, and internal builds are compared;
- the ROI audit trail freezes the decision, evidence standard, cost boundary, benefit boundary, and variance owners before purchase;
- finance can review the baseline, quote normalization sheet, evidence sample, scenario table, benefit ledger, adoption record, and exit note;
- the approval meeting has named roles, a pre-read, and explicit stop/refine/pilot/resize/buy/build/renew/expand outcomes;
- utilization and exit costs are measured rather than assumed away;
- downstream financial outcomes are added only when attribution supports them.
Start with one recurring decision, measure the current cost honestly, and make the proposed workflow earn the right to scale. If the product review mining: cost and ROI guide cannot connect the quote, evidence sample, proof ledger, and approval meeting to an accepted decision, the business case is not ready.